Chart USD/JPY Update: Choppy trade - studies under pressure
The test below 152.00 has bounced from 151.50/55, as oversold intraday studies unwind, with prices once again balanced around 152.00
| Levels | Imp | Comment | Levels | Imp | Comment | |||
|---|---|---|---|---|---|---|---|---|
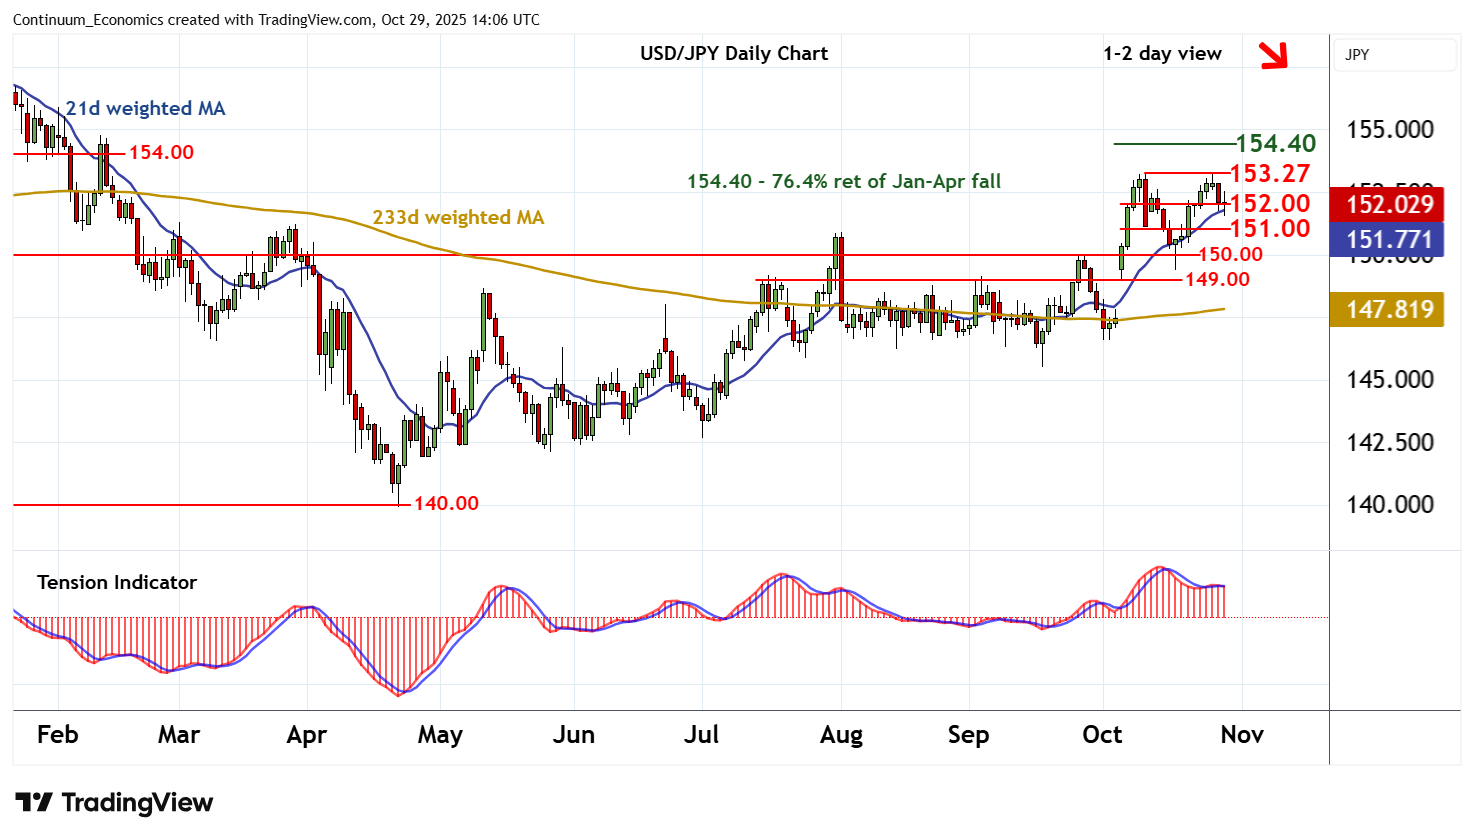
| R4 | 155.00 | * | congestion | S1 | 152.00 | congestion | ||
| R3 | 154.40 | ** | 76.4% ret of Jan-Apr fall | S2 | 151.00 | break level | ||
| R2 | 154.00 | ** | congestion | S3 | 150.00 | ** | congestion | |
| R1 | 153.27 | ** | 10 Oct (w) high | S4 | 149.37 | 17 Oct (w) low |
Asterisk denotes strength of level
13:55 GMT - The test below 152.00 has bounced from 151.50/55, as oversold intraday studies unwind, with prices once again balanced around 152.00. The daily Tension Indicator and daily stochastics have turned down, and overbought weekly stochastics are flattening, highlighting room for fresh losses in the coming sessions. A close below 152.00 will add weight to sentiment and open up 151.00. However, the rising weekly Tension Indicator could limit any initial tests in fresh consolidation. Meanwhile, a close above the 153.27 weekly high of 10 October is needed to turn sentiment positive and confirm continuation of April gains towards the 154.40 Fibonacci retracement.