Published: 2026-03-26T01:42:08.000Z
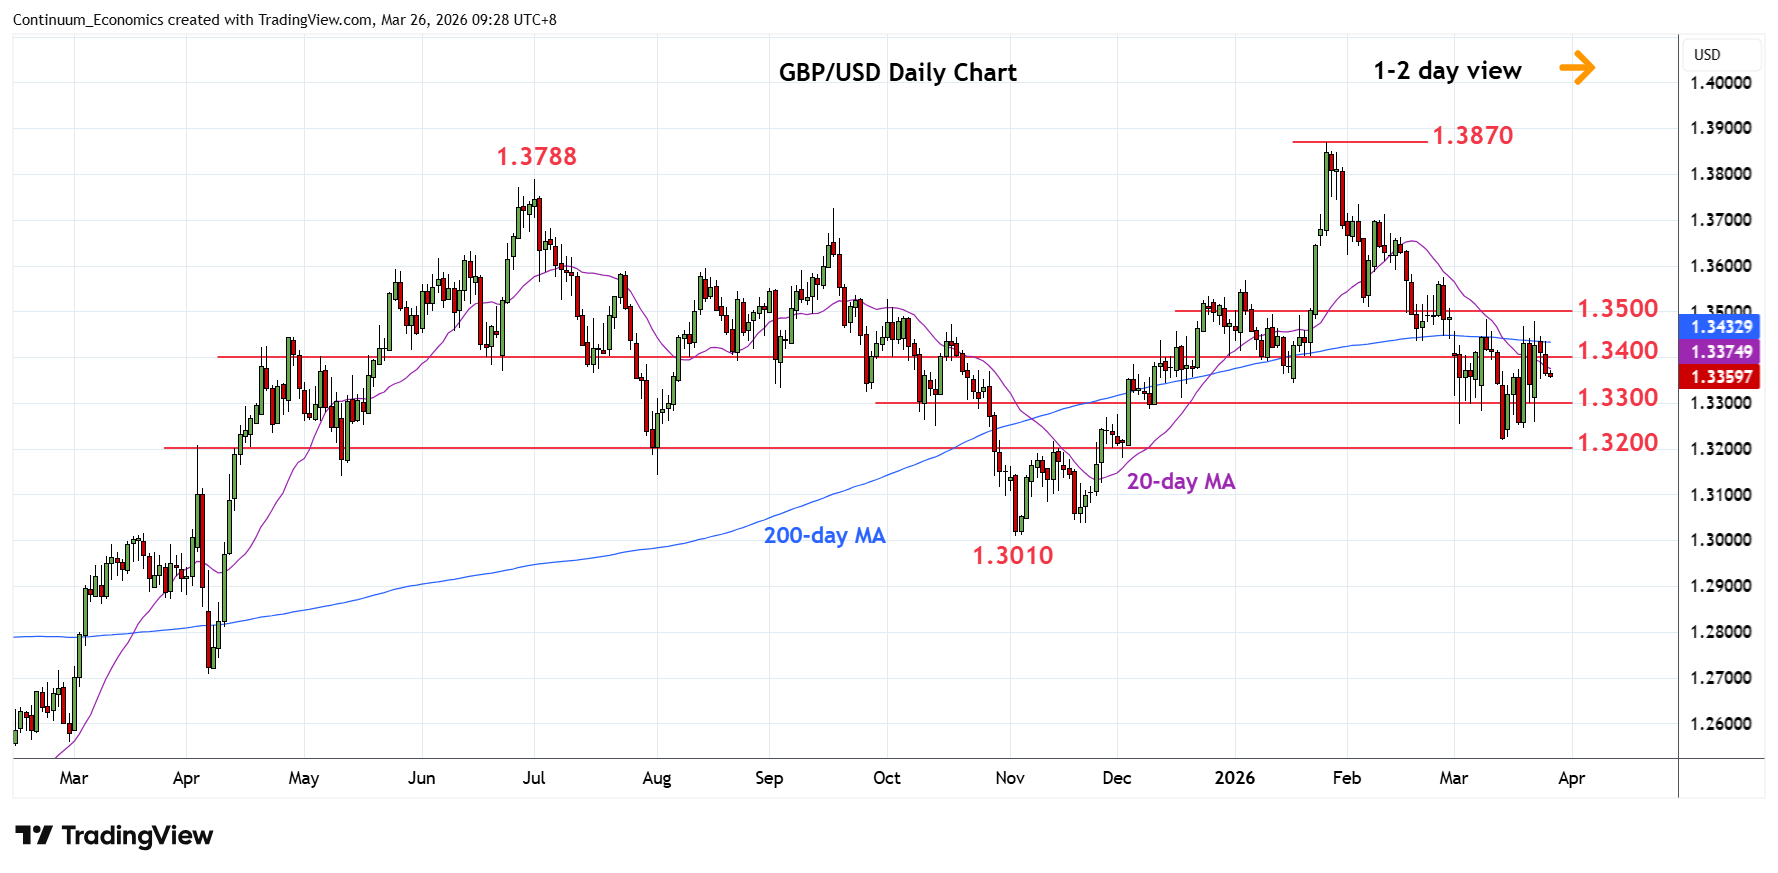
Chart GBP/USD Update: Turned lower in consolidation
2
Settled back below the 1.3400 level as resistance at the 1.3435/80, 200-day MA and 23 March high keep gains in check
| Level | Comment | Level | Comment | |||||
|---|---|---|---|---|---|---|---|---|
| R4 | 1.3500/10 | ** | congestion, 6 Feb low | S1 | 1.3300 | * | congestion | |
| R3 | 1.3480 | * | 23 Mar high | S2 | 1.3250 | * | congestion | |
| R2 | 1.3435 | * | 200-day MA | S3 | 1.3213 | ** | 13 Mar YTD low | |
| R1 | 1.3400 | * | congestion | S4 | 1.3200 | * | congestion |
Asterisk denotes strength of level
01:35 GMT - Settled back below the 1.3400 level as resistance at the 1.3435/80, 200-day MA and 23 March high keep gains in check. Pullback see support at the 1.3350/00 congestion area which should underpin. Break here will return focus to the downside for retest of the 1.3250 congestion and 1.3213, 13 March YTD low. Meanwhile, resistance lowered to the 1.3400 level which is expected to cap and sustain losses from resistance at the 1.3480 lower high. Would take break here to open up room for extension to strong resistance at 1.3500/10 area.