Chart NZD/USD Update: Leaning lower in consolidation
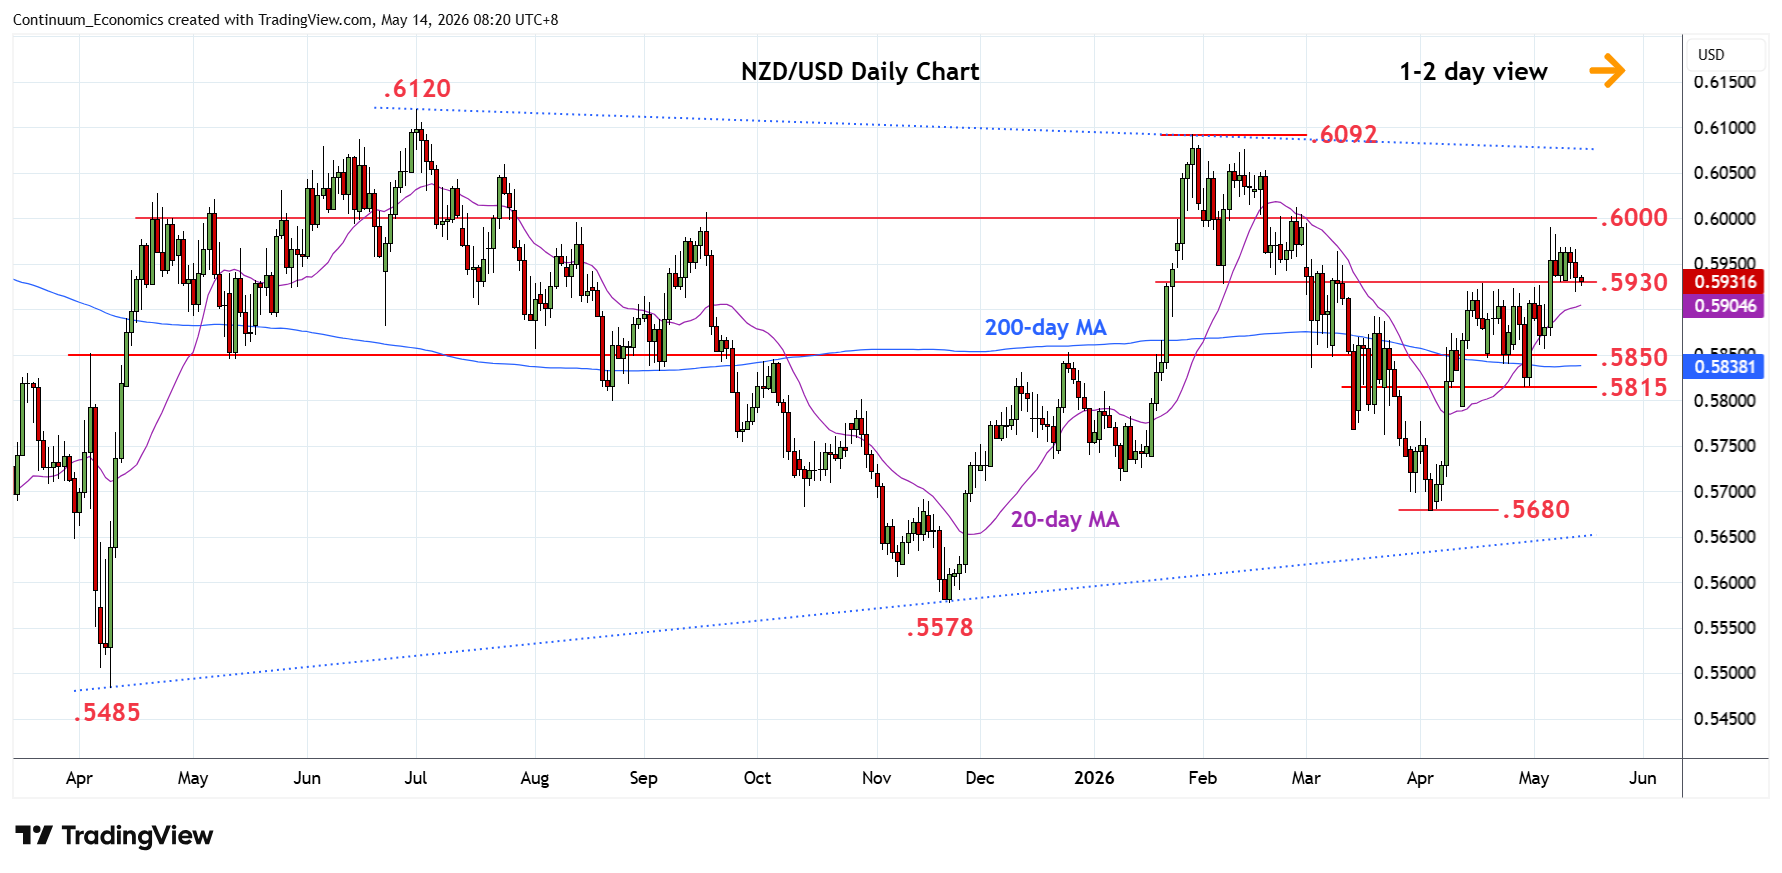
Leaning lower in consolidation from the .5990 high to pressure support at .5930
| Levels | Imp | Comment | Levels | Imp | Comment | |||
|---|---|---|---|---|---|---|---|---|
| R4 | .6120 | ** | Jul 2025 yr high | S1 | .5930 | ** | Apr high | |
| R3 | .6092 | ** | 29 Jan YTD high | S2 | .5900 | * | congestion | |
| R2 | .6050 | * | congestion | S3 | .5850 | * | congestion | |
| R1 | .6000/10 | * | congestion, 26 Feb high | S4 | .5815 | ** | 29 Apr low |
Asterisk denotes strength of level
00:30 GMT - Leaning lower in consolidation from the .5990 high to pressure support at .5930. Below this will see room to the .5900 level with the resulting flag pattern suggesting consolidation to give way to break higher later to extend gains from the .5680 April low and see scope to target the nearby resistance at the .6000/10 area. Clearance here will see potential to the .6050 congestion but focus will turn to the .6092, 29 January current year high. Meanwhile, support remains at the .5930/00 area which should underpin. Break here will open up room for deeper pullback towards support at the .5850 congestion and .5815, 29 April low.