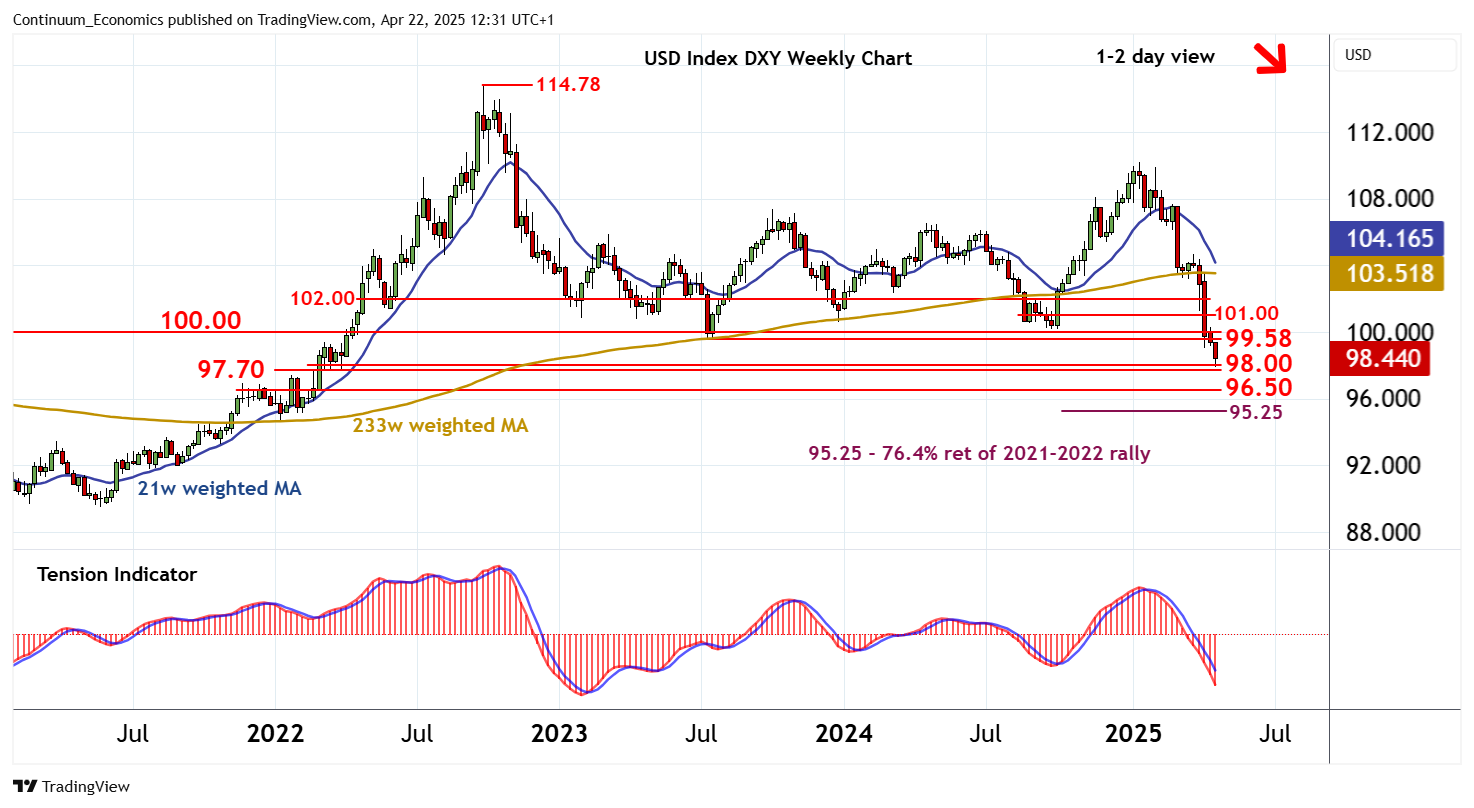
Chart USD Index DXY Update: Extending September 2022 losses

January losses have extended to congestion support at 98.00
| Levels | Imp | Comment | Levels | Imp | Comment | |||
|---|---|---|---|---|---|---|---|---|
| R4 | 102.00 | ** | break level | S1 | 98.00 | * | congestion | |
| R3 | 101.00 | * | break level | S2 | 97.70 | * | Feb-Mar 2022 break level | |
| R2 | 100.00 | ** | congestion | S3 | 96.50 | * | congestion | |
| R1 | 99.58 | ** | July 2023 (y) low | S4 | 96.00 | ** | congestion |
Asterisk denotes strength of level
12:15 BST - January losses have extended to congestion support at 98.00, where rising intraday studies and flattening oversold daily stochastics are prompting short-term consolidation. A minor bounce is possible. But the bearish daily Tension Indicator and negative weekly charts are expected to limit scope in renewed selling interest towards strong resistance at the 99.58 year low of July 2023 and congestion around 100.00. Following cautious trade, fresh losses are looked for. A break below 98.00 will add weight to sentiment and extend September 2022 losses below the 97.70 break level towards congestion within 96.00/50. Meanwhile, a close above 99.58 - 100.00 will help to stabilise price action and prompt consolidation beneath 101.00.