Published: 2026-03-06T14:06:19.000Z
Chart AUD/USD Update: Under pressure
1
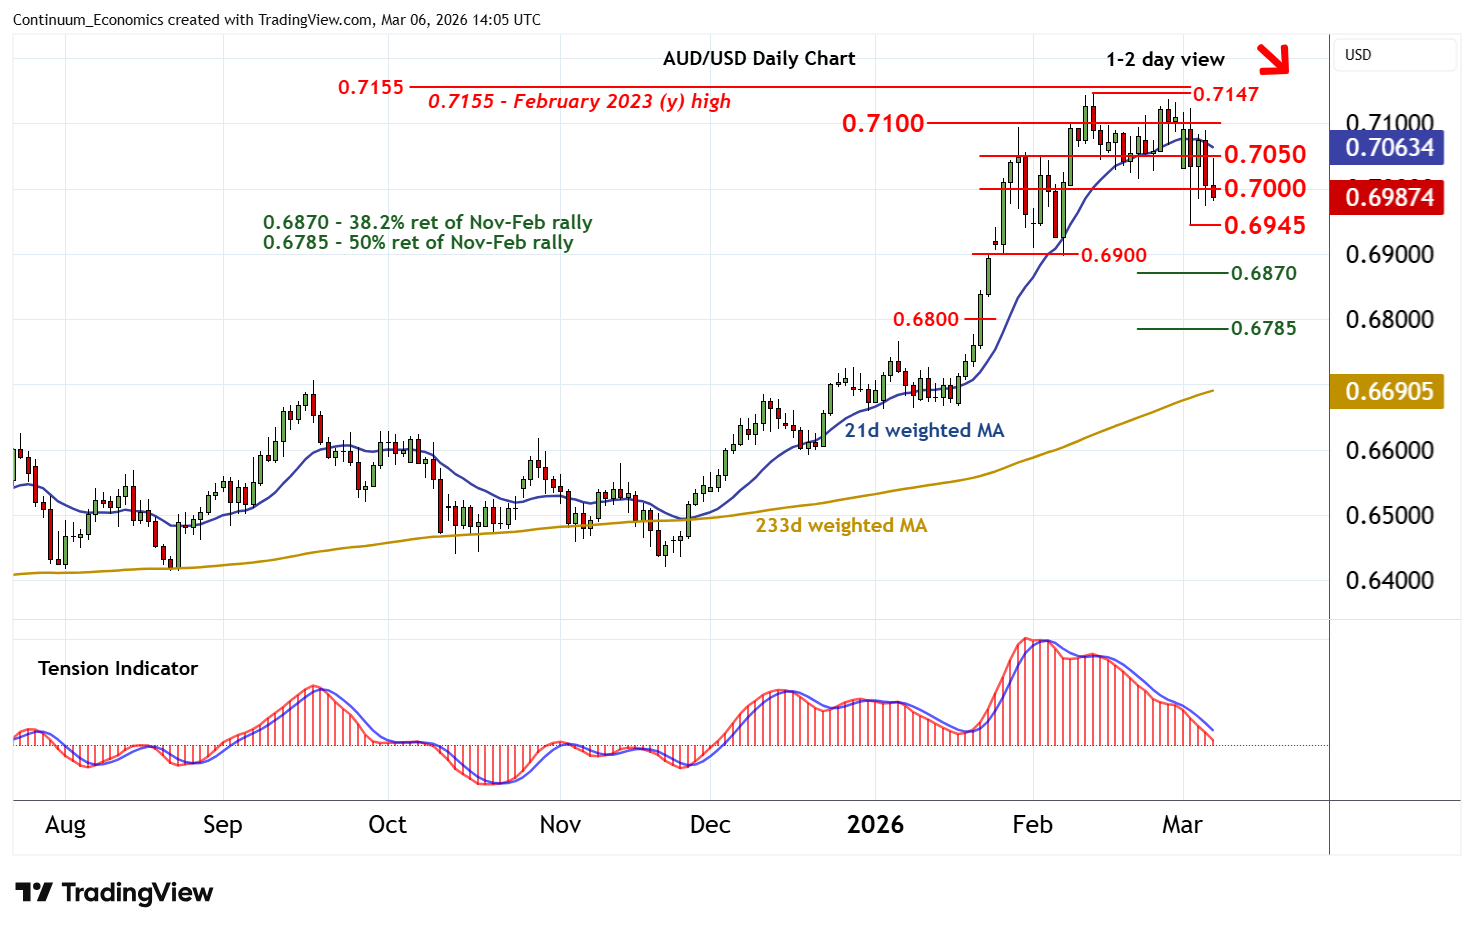
Consolidation within the 0.7000 - 0.7150 range is giving way to a test lower
| Levels | Imp | Comment | Levels | Imp | Comment | |||
|---|---|---|---|---|---|---|---|---|
| R4 | 0.7210 | ** | 61.8% ret of 2021-2025 fall | S1 | 0.7000 | * | congestion | |
| R3 | 0.7147/55~ | ** | 12 Feb YTD high; Feb 2023 (y) high | S2 | 0.6945 | 3 Mar low | ||
| R2 | 0.7100 | break level | S3 | 0.6900 | ** | break level | ||
| R1 | 0.7050 | * | congestion | S4 | 0.6870 | * | 38.2% ret of Nov-Feb rally |
Asterisk denotes strength of level
14:00 GMT - Consolidation within the 0.7000 - 0.7150 range is giving way to a test lower, as intraday studies turn down, with prices currently trading just below congestion support at 0.7000. Daily readings are under pressure, highlighting room for continuation beneath here towards the 0.6945 low of 3 March. Broader weekly charts are also under pressure. But a close beneath here is needed to turn sentiment negative and extend February losses initially to support at 0.6900. Meanwhile, resistance remains at congestion around 0.7050 and extends to 0.7100. This range should cap any immediate tests higher.