Published: 2025-12-08T07:45:28.000Z
Chart USD/CAD Update: Consolidating sharp losses last week
1
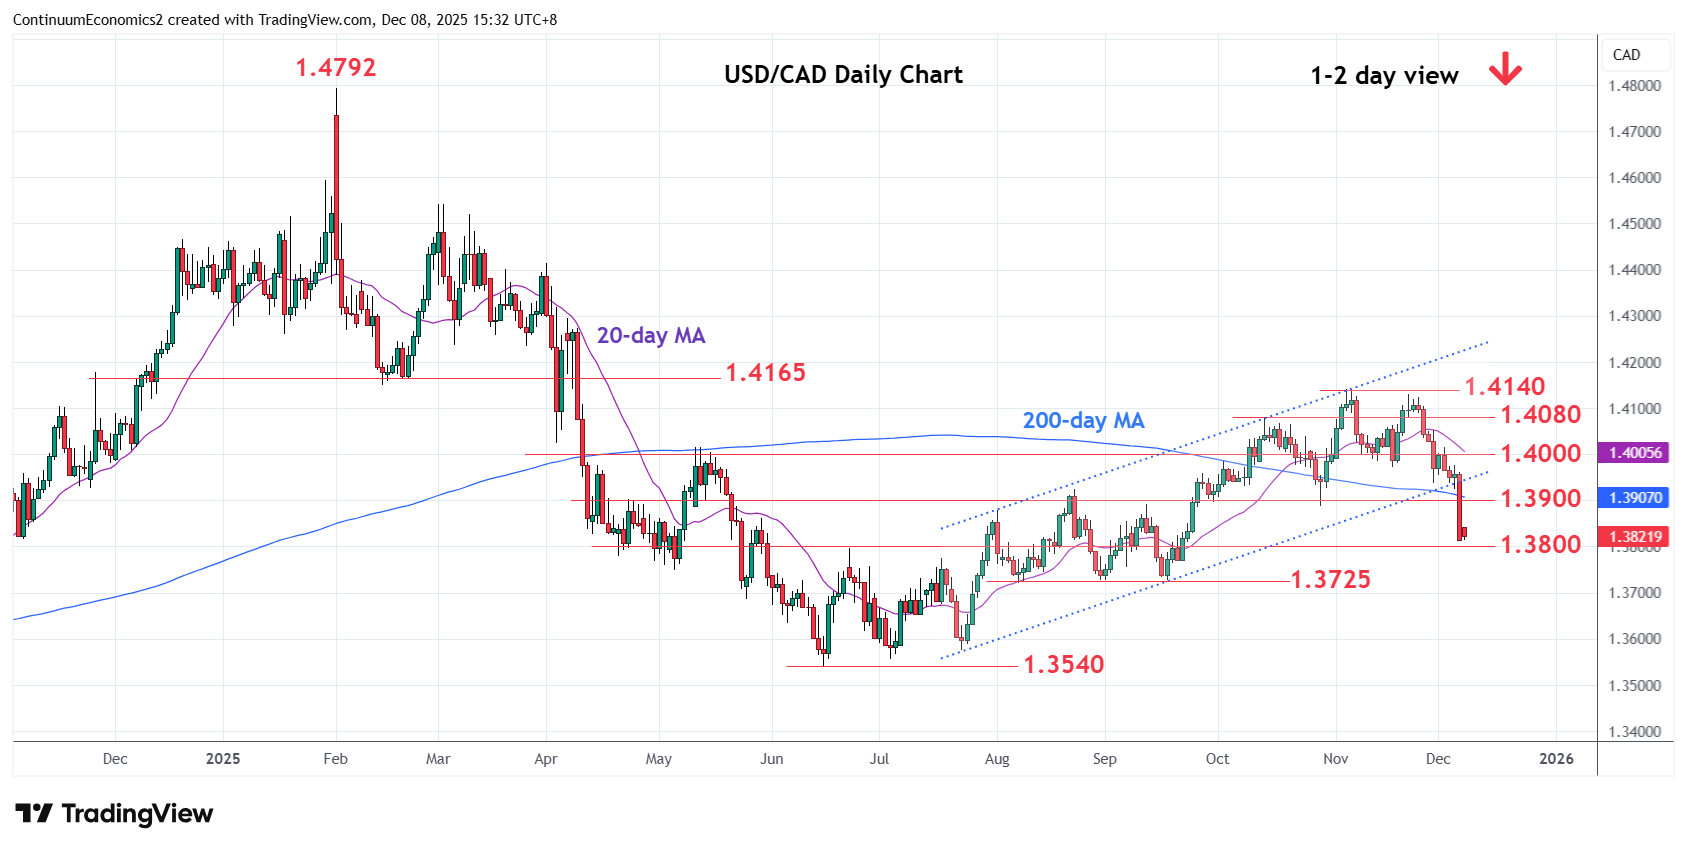
Break of the 1.3938 November low has seen sharp break of the 1.3900 support to approach the 1.3800 congestion
| Levels | Imp | Comment | Levels | Imp | Comment | |||
|---|---|---|---|---|---|---|---|---|
| R4 | 1.4080 | ** | Oct high | S1 | 1.3800 | * | congestion | |
| R3 | 1.4000 | ** | congestion | S2 | 1.3770 | * | 61.8% Jun/Nov rally | |
| R2 | 1.3938 | * | Nov low | S3 | 1.3725/20 | ** | Sep, Aug lows | |
| R1 | 1.3900 | * | congestion | S4 | 1.3700 | * | congestion |
Asterisk denotes strength of level
07:40 GMT - Break of the 1.3938 November low has seen sharp break of the 1.3900 support to approach the 1.3800 congestion. Consolidation here see prices unwinding oversold intraday studies but this is expected to give way to renewed selling pressure later. Break will see room to further retrace the June/November rally to target 1.3770, 61.8% Fibonacci level. Below this will see room to strong support at the 1.3725/20, September/August lows. Meanwhile, resistance is lowered to the 1.3900/40 congestion and November low which is expected to cap and sustain losses from 1.4130/40 highs.