Published: 2026-04-28T11:52:07.000Z
Chart USD/RUB Update: Choppy trade - background studies under pressure
2
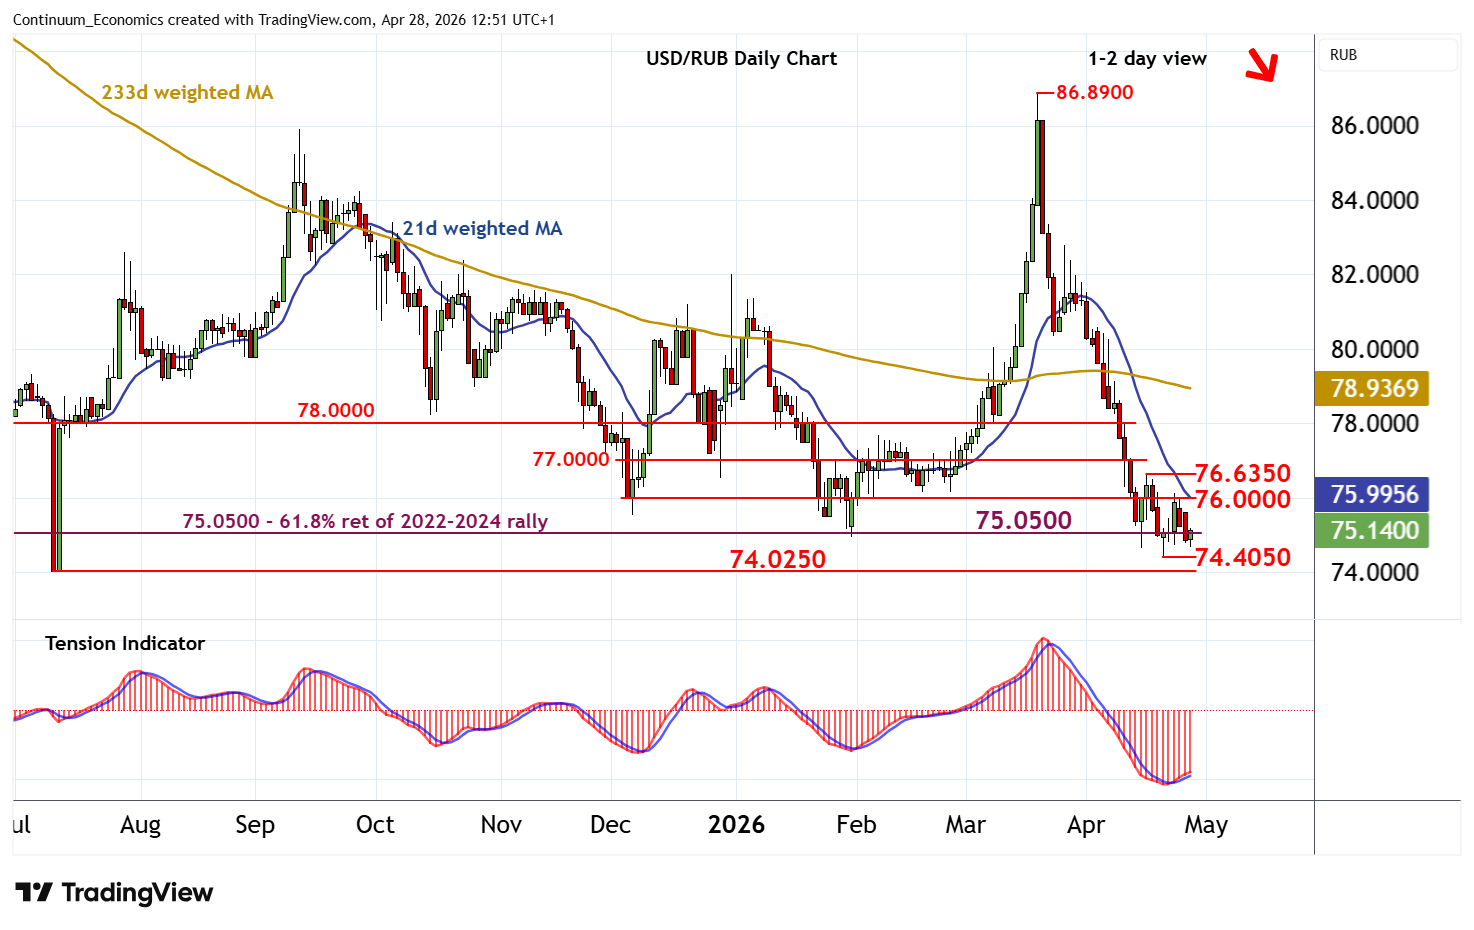
Little change, as prices extend choppy trade around the 75.0500 multi-month Fibonacci retracement
| Levels | Comment | Levels | Comment | |||||
| R4 | 78.0000 | * | congestion | S1 | 75.0500 | ** | 76.4% ret of 2022-2024 rally | |
| R3 | 77.0000 | ** | congestion | S2 | 74.4050 | * | 21 Apr YTD low | |
| R2 | 76.6350 | * | 16 Apr high | S3 | 74.0250 | ** | 10 Jul 2025 (y) low | |
| R1 | 76.0000 | * | congestion | S4 | 72.6800 | * | late-Feb 2023 (w) low |
Asterisk denotes strength of level
12:30 BST - Little change, as prices extend choppy trade around the 75.0500 multi-month Fibonacci retracement. Daily readings continue to track higher, suggesting room for a test of congestion resistance at 76.0000. But negative weekly charts should limit any break in renewed selling interest beneath the 96.6350 high of 16 April. Following cautious trade, fresh losses are looked for. Support is strong down to the 74.4050 current year low of 21 April. But a close below the 74.0250 year low of 10 July 2025 is needed to turn sentiment negative and extend November 2024 losses into 3-year lows.