Chart USD/ZAR Update: Under pressure once again
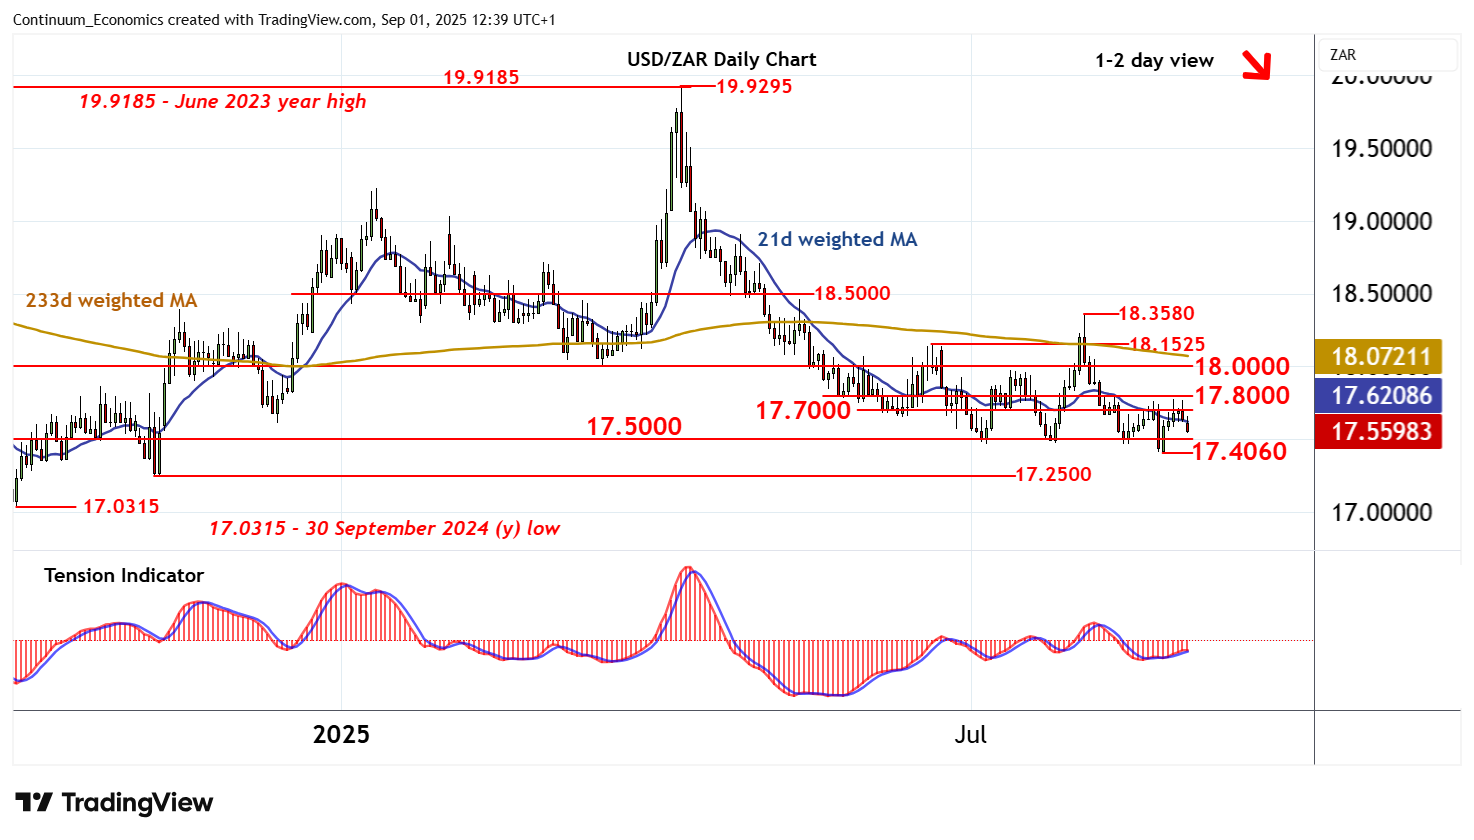
The test of congestion resistance within 17.7000-17.8000 has not been sustained
| Level | Comment | Level | Comment | |||||
|---|---|---|---|---|---|---|---|---|
| R4 | 18.1525 | ** | 19 Jun (m) high | S1 | 17.5000 | ** | congestion | |
| R3 | 18.0000 | ** | congestion | S2 | 17.4060 | ** | 25 Aug YTD low | |
| R2 | 17.8000 | * | congestion | S3 | 17.2500 | ** | 7 Nov (m) low | |
| R1 | 17.7000 | * | congestion | S4 | 17.0315 | ** | 30 Sep 2024 (y) low |
Asterisk denotes strength of level
12:25 BST - The test of congestion resistance within 17.7000-17.8000 has not been sustained, as intraday studies turn down once again, with focus back on congestion support at 17.5000. Overbought daily stochastics are unwinding and the flat daily Tension Indicator is also turning down, highlighting room for a break beneath here towards strong support at the 17.4060 current year low of 25 August. Mixed weekly charts suggest any immediate tests of this range could be limited in consolidation. But a close below 17.4060 will add weight to sentiment and extend April losses towards critical support at the 17.0315 year low of 30 September 2024. Meanwhile, the 17.7000-17.8000 range should cap any immediate tests higher.