Published: 2026-03-17T01:58:12.000Z
Chart GBP/USD Update: Range-bound in consolidation
2
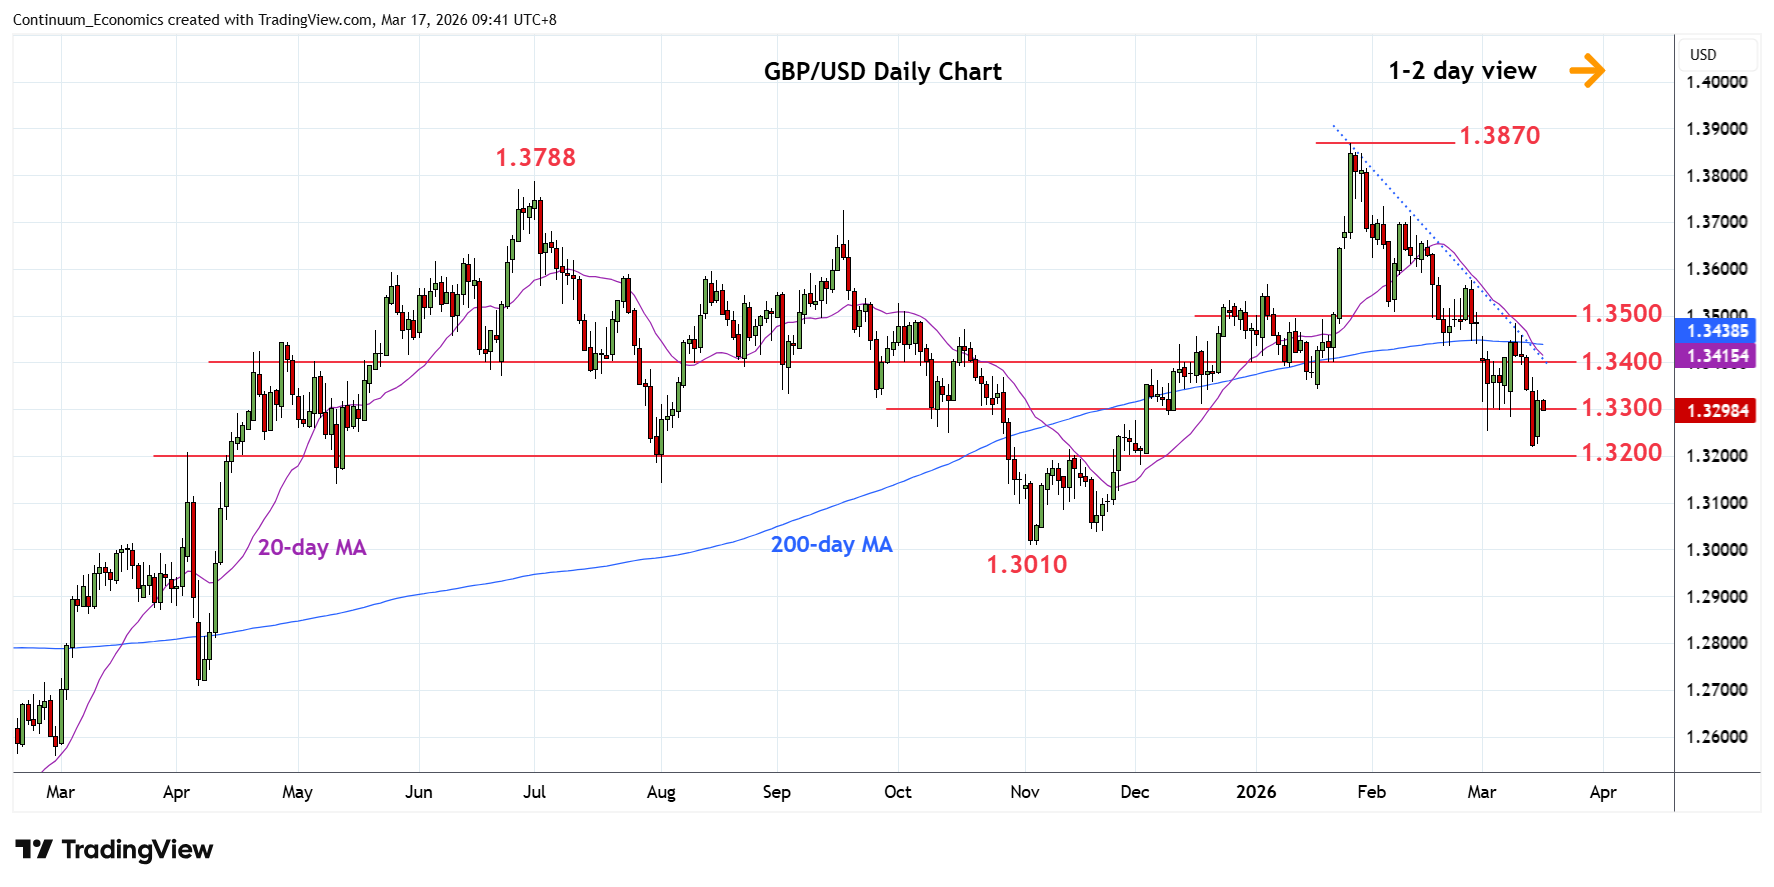
Turned up in range from the 1.3213 Friday's current year low as prices consolidate losses from the 1.3483 high of last week
| Level | Comment | Level | Comment | |||||
|---|---|---|---|---|---|---|---|---|
| R4 | 1.3483 | ** | 10 Mar high | S1 | 1.3250 | * | congestion | |
| R3 | 1.3435 | ** | 19 Feb low | S2 | 1.3213 | ** | 13 Mar YTD low | |
| R2 | 1.3400 | * | congestion | S3 | 1.3150 | * | congesion | |
| R1 | 1.3350 | * | congestion | S4 | 1.3100 | * | congestion |
Asterisk denotes strength of level
01:50 GMT - Turned up in range from the 1.3213 Friday's current year low as prices consolidate losses from the 1.3483 high of last week. Above the 1.3300 level opens up room for stronger bounce to resistance at the 1.3350/1.3400 congestion area. Higher, if seen, should see strong resistance at the 1.3435/83 area which is expected to cap and sustain losses from the January high. Meanwhile, support is raised to the 1.3250 congestion ahead of 1.3213 YTD low. Break here will further extend the January losses and see room to the 1.3150/3100 congestion area.