Chart GBP/USD Update: Extending losses
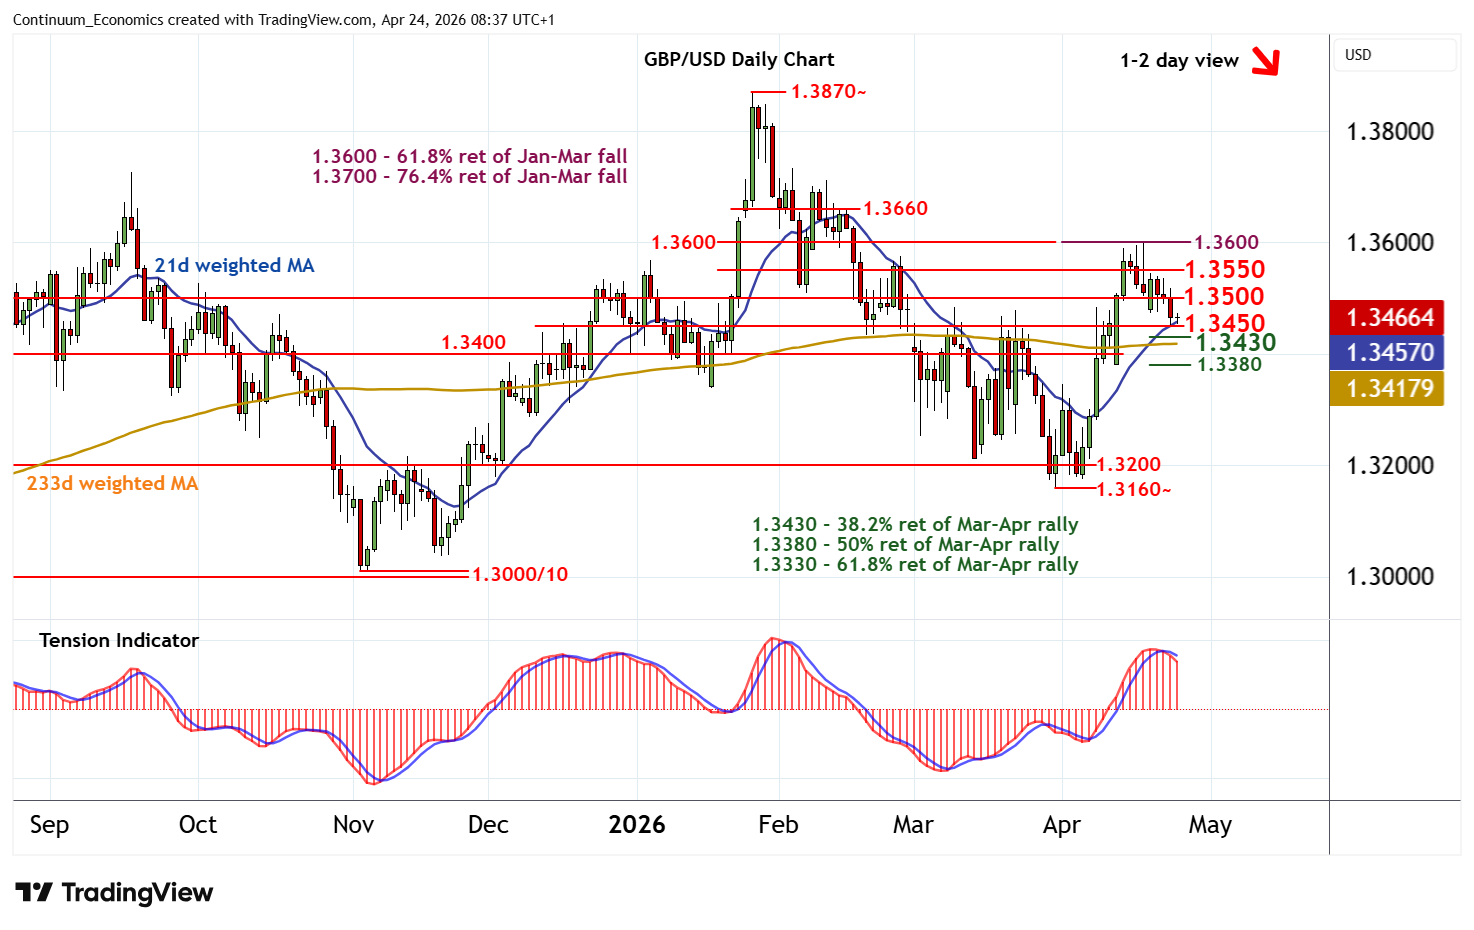
Anticipated losses have reached support at 1.3450
| Level | Comment | Level | Comment | |||||
|---|---|---|---|---|---|---|---|---|
| R4 | 1.3660 | * | congestion | S1 | 1.3450 | break level | ||
| R3 | 1.3600 | ** | congestion; 61.8% ret | S2 | 1.3430 | * | 38.2% ret of Mar-Apr rally | |
| R2 | 1.3550 | * | congestion | S3 | 1.3400 | ** | congestion | |
| R1 | 1.3500 | ** | congestion | S4 | 1.3380 | ** | 50% ret of Mar-Apr rally |
Asterisk denotes strength of level
08:10 BST - Anticipated losses have reached support at 1.3450, where flat oversold intraday studies are prompting short-term reactions. Daily stochastics and the daily Tension Indicator continue to track lower, highlighting room for a test beneath here towards the 1.3430 Fibonacci retracement. However, rising weekly charts should limit any deeper losses in renewed buying interest towards congestion around 1.3400. Meanwhile, resistance remains at congestion around 1.3500. A close back above here will help to stabilise price action and prompt consolidation beneath further congestion around 1.3550. A further close above stronger resistance at 1.3600 is needed to turn sentiment positive and extend late-March gains towards congestion around 1.3660.