Published: 2026-05-07T06:30:02.000Z
Chart AUD/NZD Update: Leaning lower from the 1.2200/35, April highs
-
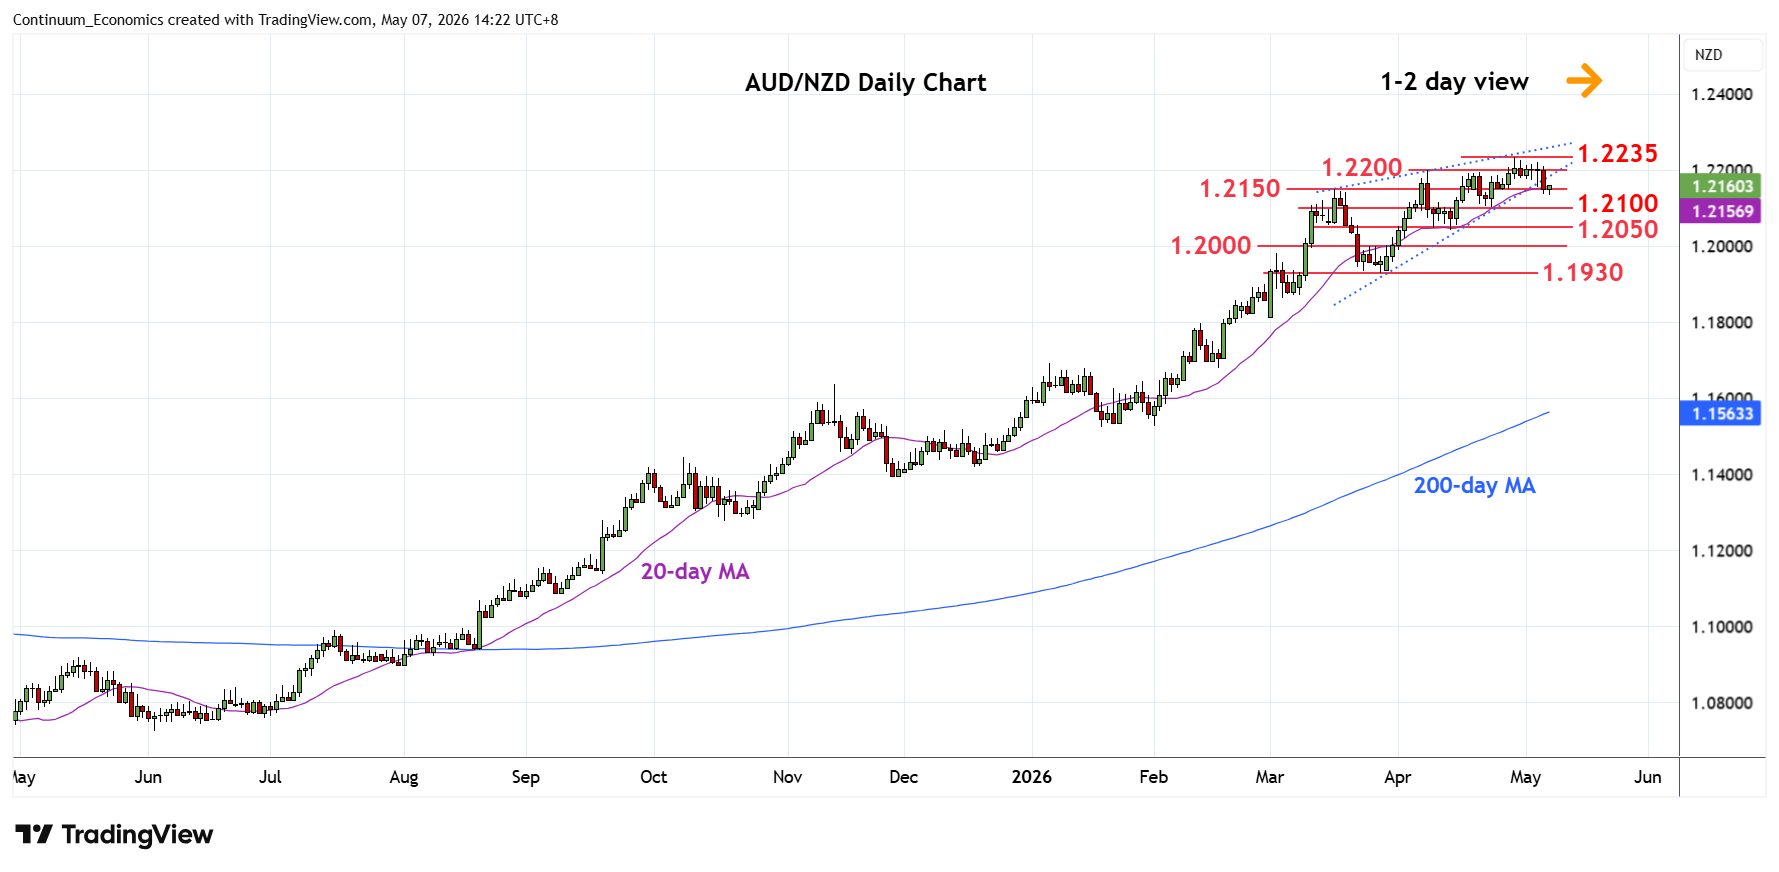
Leaning lower from the 1.2200/35 highs as prices consolidate gains within a 2-month rising wedge pattern from the March low
| Level | Comment | Level | Comment | |||||
|---|---|---|---|---|---|---|---|---|
| R4 | 1.2350 | * | 61.8% 2011/2020 fall | S1 | 1.2150 | * | Mar high | |
| R3 | 1.2300/10 | ** | congestion, 2011 yr low | S2 | 1.2100 | ** | 23 Apr low | |
| R2 | 1.2235 | ** | 29 Apr YTD high | S3 | 1.2050 | ** | congestion | |
| R1 | 1.2200 | * | 8 Apr high, congestion | S4 | 1.2000 | * | congestion |
Asterisk denotes strength of level
06:30 GMT - Leaning lower from the 1.2200/35 highs as prices consolidate gains within a 2-month rising wedge pattern from the March low and threatens break of support at 1.2150, March high. Daily studies are unwinding overbought readings and break here will open up room for deeper pullback to support at the 1.2100/1.2050 congestion area. Lower still, will see scope to the 1.2000 figure then the 1.1930, 27 March low. Meanwhile, resistance remains at the 1.2200/35 April highs. Clearance, if seen, will see scope for extension to 1.2300 congestion and 1.2350, 61.8% Fibonacci retracement.