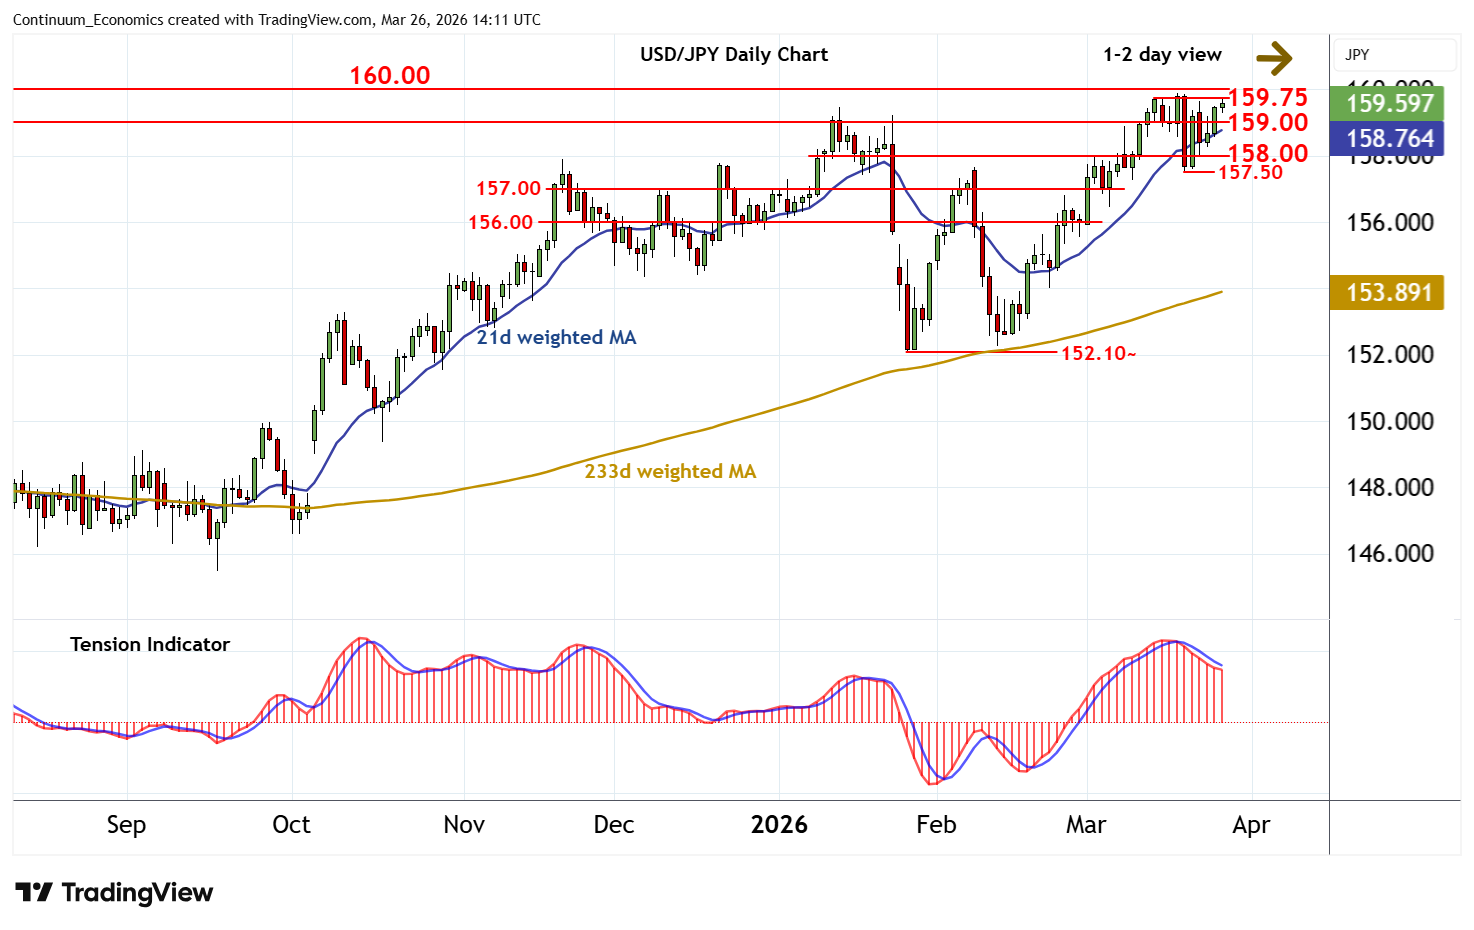
Chart USD/JPY Update: Pressuring strong resistance - background improving
Cautious trade has given way to the anticipated test of strong resistance at the 159.75 weekly high of 13 March
| Levels | Imp | Comment | Levels | Imp | Comment | |||
|---|---|---|---|---|---|---|---|---|
| R4 | 161.00 | July 2024 congestion | S1 | 159.00 | * | congestion | ||
| R3 | 160.40 | ** | April 1990 (y) high | S2 | 158.00 | * | break level | |
| R2 | 160.00 | ** | historic congestion | S3 | 157.50 | * | 19 Mar (w) low | |
| R1 | 159.75 | ** | 13 Mar (w) high | S4 | 157.00 | congestion |
Asterisk denotes strength of level
13:55 GMT - Cautious trade has given way to the anticipated test of strong resistance at the 159.75 weekly high of 13 March, where unwinding overbought intraday studies and the negative daily Tension Indicator are prompting a minor pullback to 159.55. Daily stochastics have turned higher, however, and broader weekly charts are rising, highlighting room for further gains in the coming sessions. But a close above the 160.40 year high of April 1990 is needed to turn sentiment positive and confirm continuation of long-term bull trends. Meanwhile, any immediate tests below congestion support at 159.00 should give way to consolidation above 158.00.