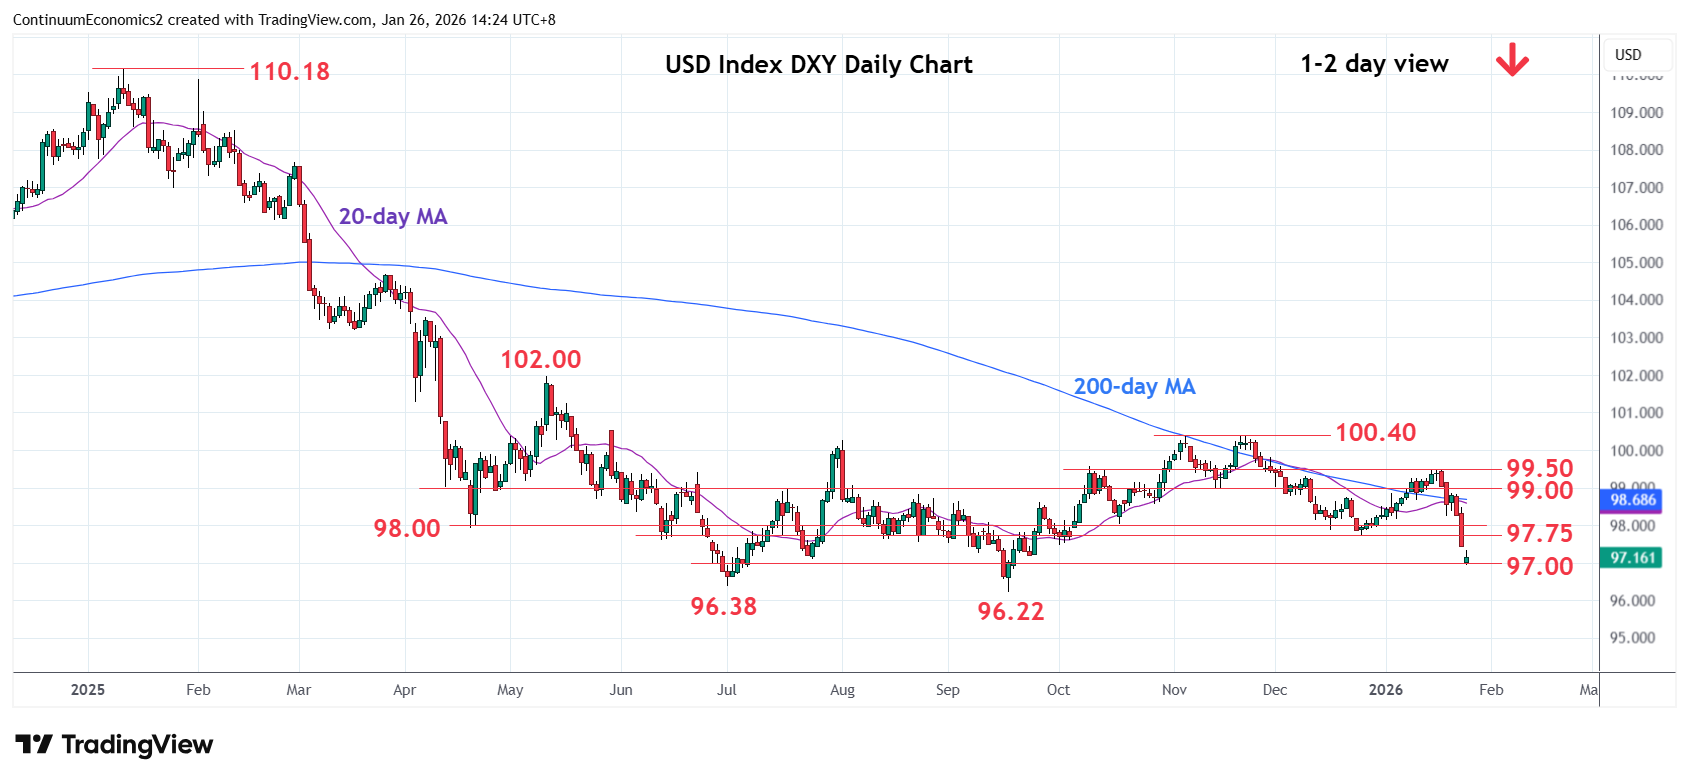
Chart USD Index DXY Update: Consolidating at 97.00, room for lower later
Gapped down at the open see prices extending sharp losses last week from the 99.50 high to reach the 97.00 level
| Levels | Imp | Comment | Levels | Imp | Comment | |||
|---|---|---|---|---|---|---|---|---|
| R4 | 99.00 | ** | congestion | S1 | 97.00 | * | congestion | |
| R3 | 98.25 | * | 20 Jan low | S2 | 96.38 | * | Jul low | |
| R2 | 98.00 | * | congestion | S3 | 96.22 | ** | Sep 2025 year low | |
| R1 | 97.75 | ** | Dec low | S4 | 95.25 | * | 76.4% 2021/2022 rally |
Asterisk denotes strength of level
06:40 GMT - Gapped down at the open see prices extending sharp losses last week from the 99.50 high to reach the 97.00 level. Consolidation here see prices unwinding the oversold intraday studies but daily and weekly studies continue to track lower, highlighting room for further losses ahead. Break here will return focus to the 96.38 and 96.22, July and September 2025 year low. Would expect reaction at these lows to consolidate losses from the 100.40, November swing high. Break here will extend the broader losses from the 2022 year high. Meanwhile, resistance is lowered to the 97.75/98.00, December low and congestion area.