Published: 2026-02-25T07:28:46.000Z
Chart AUD/NZD Update: Extending gains
1
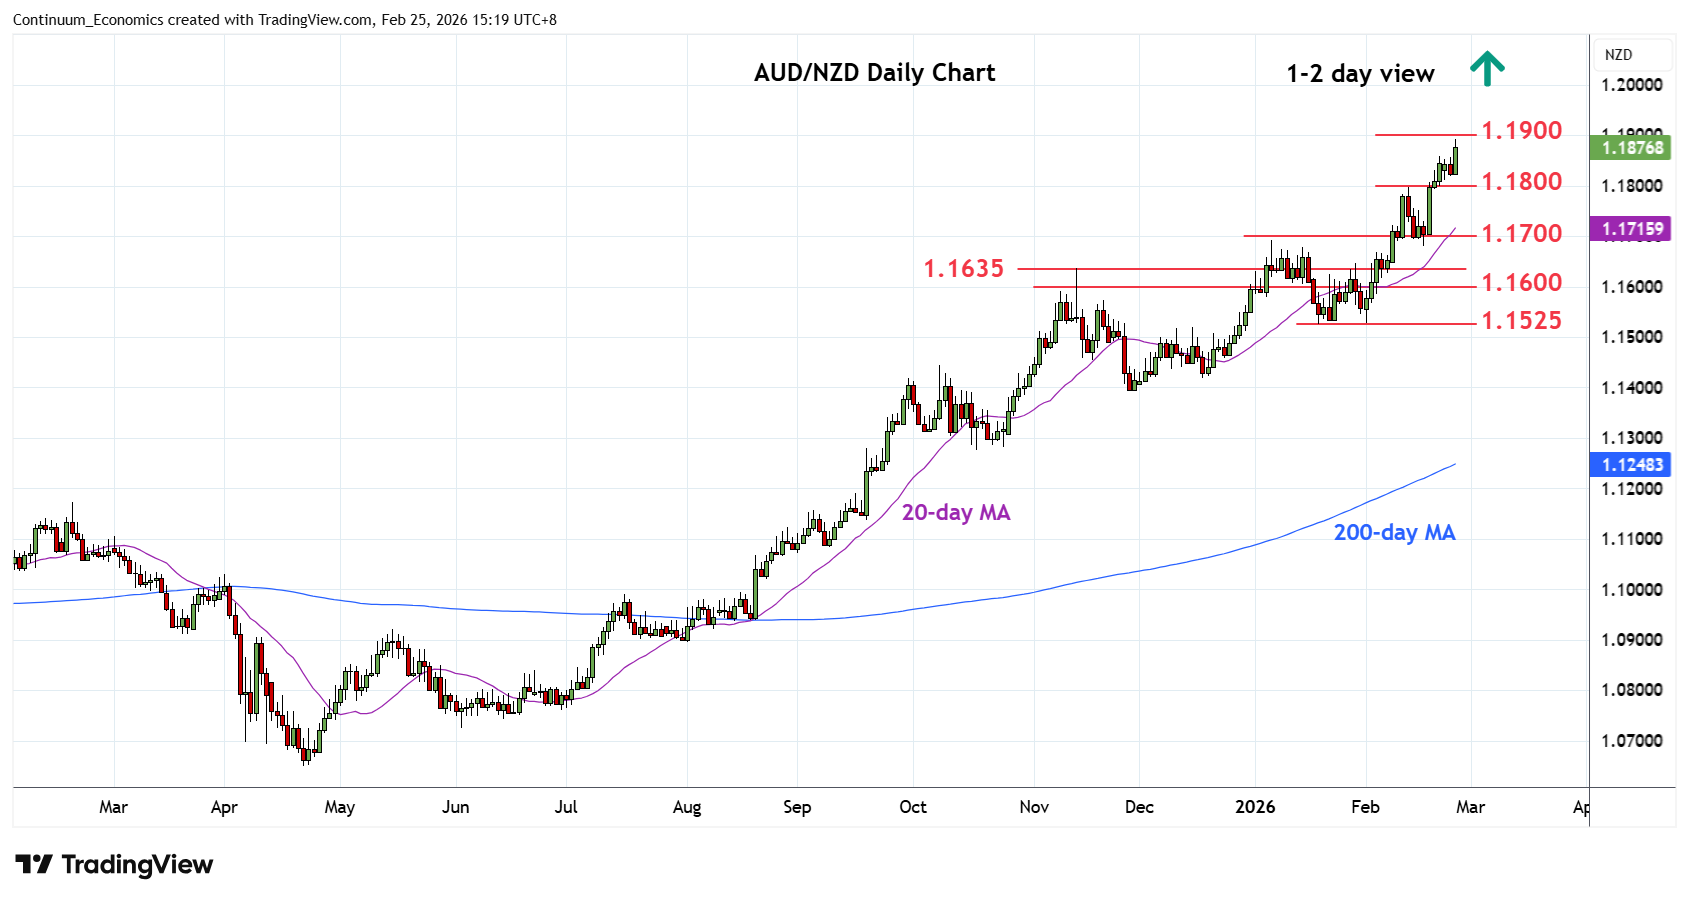
Break to fresh year high see prices extending bullish gains from the April 2025 year low to reach towards the 1.1900, 50% Fibonacci level
| Level | Comment | Level | Comment | |||||
|---|---|---|---|---|---|---|---|---|
| R4 | 1.2140 | * | Feb 2013 low | S1 | 1.1800 | * | congestion | |
| R3 | 1.2100 | * | Jun 2013 high | S2 | 1.1750 | * | congestion | |
| R2 | 1.2000 | ** | figure, congestion | S3 | 1.1700/80 | * | congestion, 17 Feb low | |
| R1 | 1.1900 | * | 50% 2011/2020 fall | S4 | 1.1635/00 | ** | Nov 2025 yr high, congestion |
Asterisk denotes strength of level
07:25 GMT - Break to fresh year high see prices extending bullish gains from the April 2025 year low to reach towards the 1.1900, 50% Fibonacci level. Beyond this will see room for extension to the 1.2000 figure where reaction can be expected to unwind overbought daily and weekly studies. Meanwhile, support remains at the 1.1800 level and this should underpin and limit corrective pullback. Would take break here to ease the upside pressure and open up room for deeper pullback to strong support at 1.1700/1.1635 previous highs.