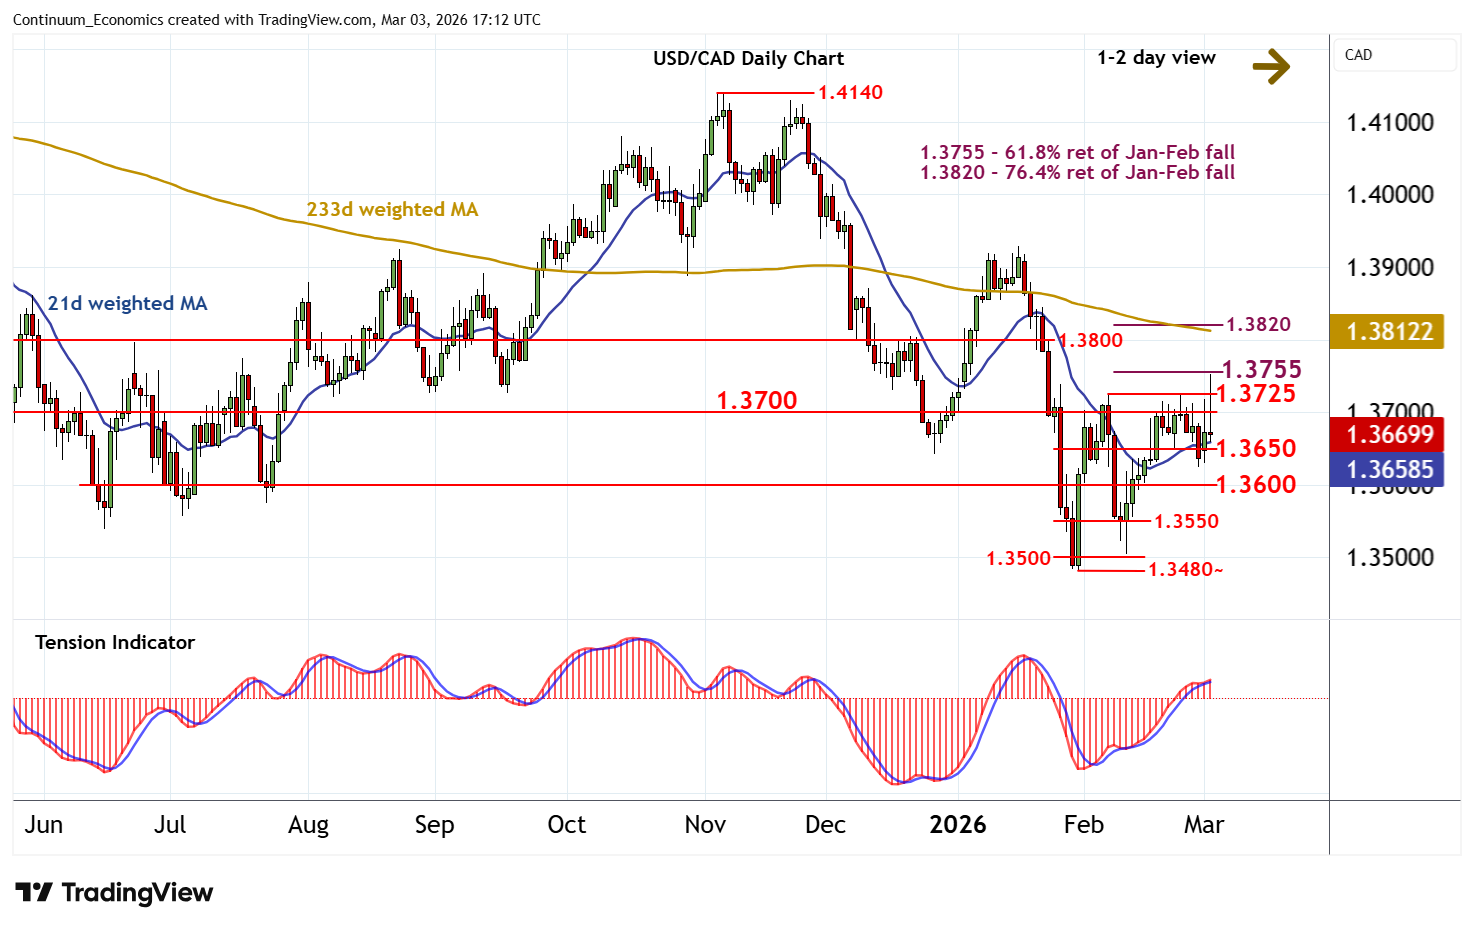
Chart USD/CAD Update: Sharp reaction at the 1.3755 Fibonacci retracement
The anticipated break above resistance within congestion around 1.3700 and the 1.3725 monthly high of 6 February has been pushed back sharply from the 1.3755 Fibonacci retracement in CAD-driven trade
| Levels | Imp | Comment | Levels | Imp | Comment | |||
|---|---|---|---|---|---|---|---|---|
| R4 | 1.3800 | ** | congestion | S1 | 1.3650 | minor congestion | ||
| R3 | 1.3755 | ** | 61.8% ret of Jan-Feb fall | S2 | 1.3600 | * | congestion | |
| R2 | 1.3725 | * | 6 Feb (m) high | S3 | 1.3550 | congestion | ||
| R1 | 1.3700 | * | congestion | S4 | 1.3500 | ** | congestion |
Asterisk denotes strength of level
16:45 GMT - The anticipated break above resistance within congestion around 1.3700 and the 1.3725 monthly high of 6 February has been pushed back sharply from the 1.3755 Fibonacci retracement in CAD-driven trade, with prices once again balanced beneath 1.3700. Daily stochastics are falling, suggesting room for a test of congestion support at 1.3650. But the rising daily Tension Indicator and improving weekly charts should limit scope in renewed buying interest towards further congestion around 1.3600. Following cautious trade, fresh gains are looked for. But a close above 1.3700/25 is needed to turn sentiment positive and confirm continuation of late-January gains.