Published: 2026-01-19T07:36:22.000Z
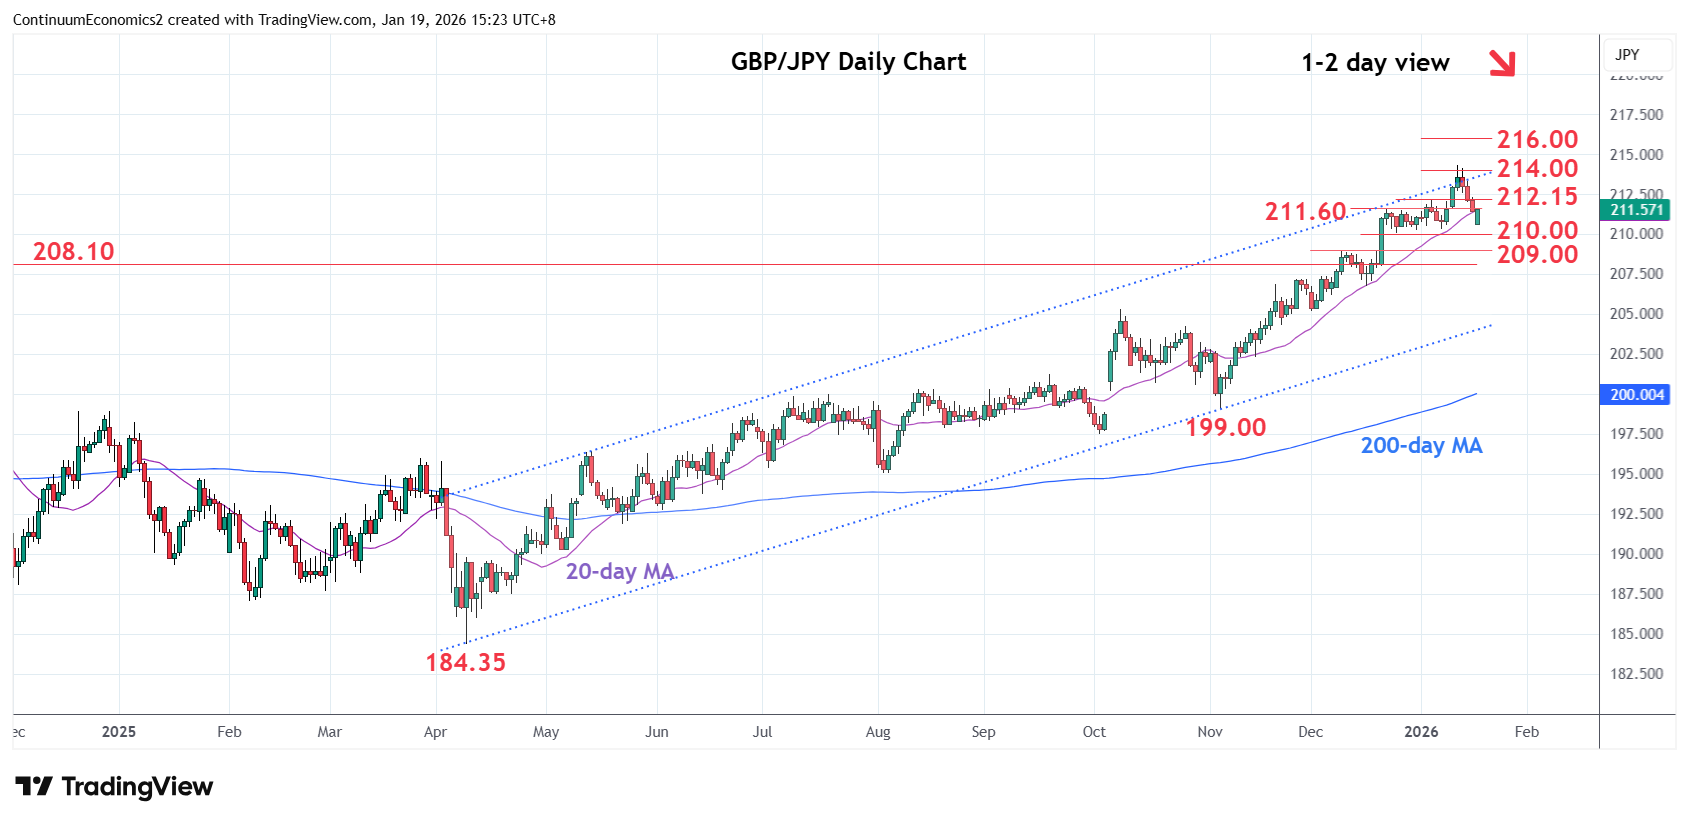
Chart GBP/JPY Update: Consolidating losses to 210.60 low
-
Weak opening saw prices gapping down to 210.60 low ahead of bounce to reach resistance at the 211.60/212.15 area
| Levels | Imp | Comment | Levels | Imp | Comment | |||
|---|---|---|---|---|---|---|---|---|
| R4 | 217.30 | * | 8 Jan 2008 high | S1 | 210.60 | intraday low | ||
| R3 | 216.00 | ** | Jul 2008 high | S2 | 210.00 | * | congestion | |
| R2 | 214.00/30 | ** | congestion, 13 Jan YTD high | S3 | 209.00 | ** | 9 Dec high | |
| R1 | 212.00/15 | * | congestion, 6 Jan high | S4 | 208.10 | ** | congestion, 2024 year high |
Asterisk denotes strength of level
07:50 GMT - Weak opening saw prices gapping down to 210.60 low ahead of bounce to reach resistance at the 211.60/212.15 area. Bounce see prices unwinding overbought intraday studies but negative daily and weekly studies suggest this giving way to renewed selling pressure later. Lower will see room for deeper pullback to retrace strong gains from the 199.00 low of November. Meanwhile, resistance is lowered to the 211.60/212.15 resistance. Regaining this will return focus to the 214.00/30 highs.