Published: 2025-02-17T02:48:26.000Z
Chart USD/THB Update: Scope to retest 33.50 low

Technical Analyst
-
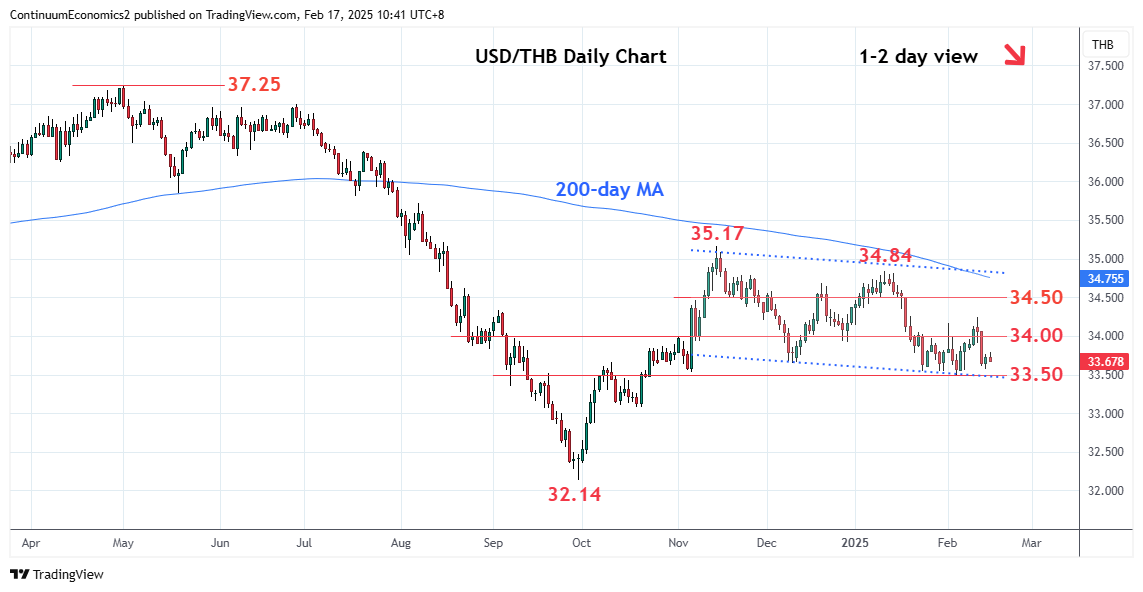
Edged up from the 33.58 low as prices consolidate losses from the 34.25 bounce high
| Level | Comment | Level | Comment | |||||
|---|---|---|---|---|---|---|---|---|
| R4 | 34.50 | * | congestion | S1 | 33.58 | 14 Feb low | ||
| R3 | 34.35 | * | 17 Jan low | S2 | 33.50 | ** | 5 Feb YTD low | |
| R2 | 34.25 | ** | 12 Feb high | S3 | 33.30 | * | 61.8% Sep/Nov rally | |
| R1 | 34.00 | * | congestion | S4 | 33.08 | * | 18 Oct low |
Asterisk denotes strength of level
02:45 GMT - Edged up from the 33.58 low as prices consolidate losses from the 34.25 bounce high and unwind the oversold intraday studies. Negative daily studies keep focus on the downside and see scope to retest the 33.50 low. Break here will extend the broader losses from the 35.17 high of November to retrace rally from the September low towards 33.30, 61.8% Fibonacci level. Meanwhile, resistance is lowered to the 34.00 congestion and this is now expected to cap and sustain losses from the 34.25 high.