Chart EUR/USD Update: Short-term consolidation - studies under pressure
Little change, as rising intraday studies and flat oversold daily stochastics prompt cautious trade
| Levels | Imp | Comment | Levels | Imp | Comment | |||
|---|---|---|---|---|---|---|---|---|
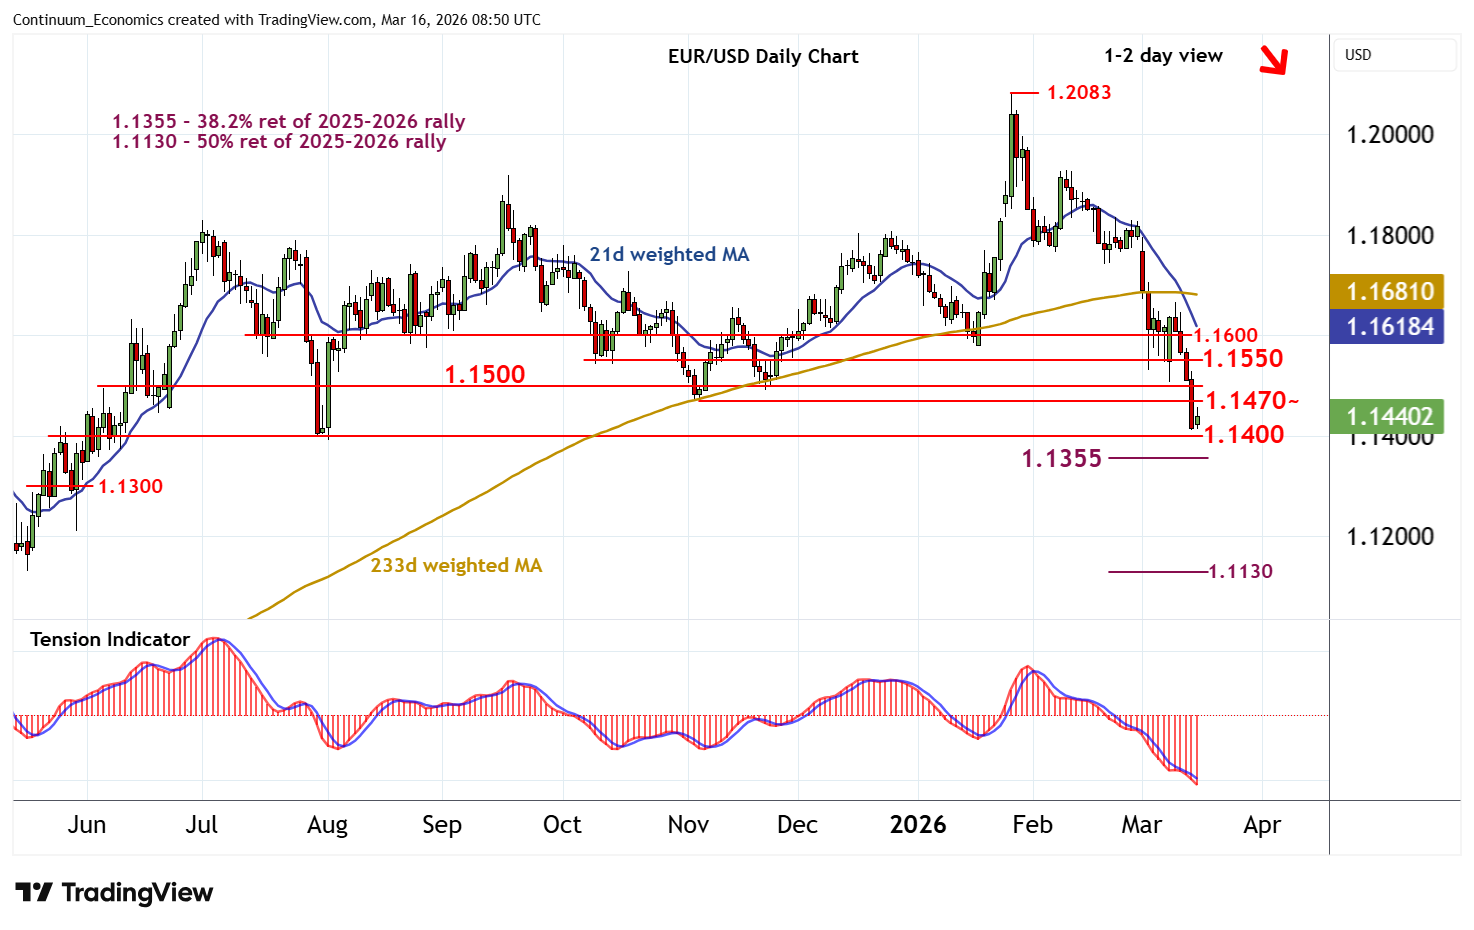
| R4 | 1.1600 | ** | congestion | S1 | 1.1400/10 | * | cong; 13 Mar YTD low | |
| R3 | 1.1550 | * | congestion | S2 | 1.1355 | ** | 38.2% ret of 2025-2026 rally | |
| R2 | 1.1500 | ** | congestion | S3 | 1.1300 | * | congestion | |
| R1 | 1.1470~ | ** | 5 Nov (m) low | S4 | 1.1200 | * | break level |
*Asterisk denotes strength of level
08:30 GMT - Little change, as rising intraday studies and flat oversold daily stochastics prompt cautious trade above congestion support at 1.1400 and the 1.1410~ current year low of 13 March. However, the daily Tension Indicator is under pressure and broader weekly charts are bearish, highlighting room for further losses in the coming sessions. A close below 1.1400/10 will add weight to sentiment and extend late-January losses towards the 1.1355 Fibonacci retracement. Still lower is congestion around 1.1300. Meanwhile, resistance remains at the 1.1470~ monthly low of 5 November and extends to congestion around 1.1500. A close above this range, if seen, would help to stabilise price action and prompt consolidation beneath further congestion around 1.1550.