Published: 2026-03-16T16:54:20.000Z
Chart USD/CAD Update: Downside tests to remain limited
3
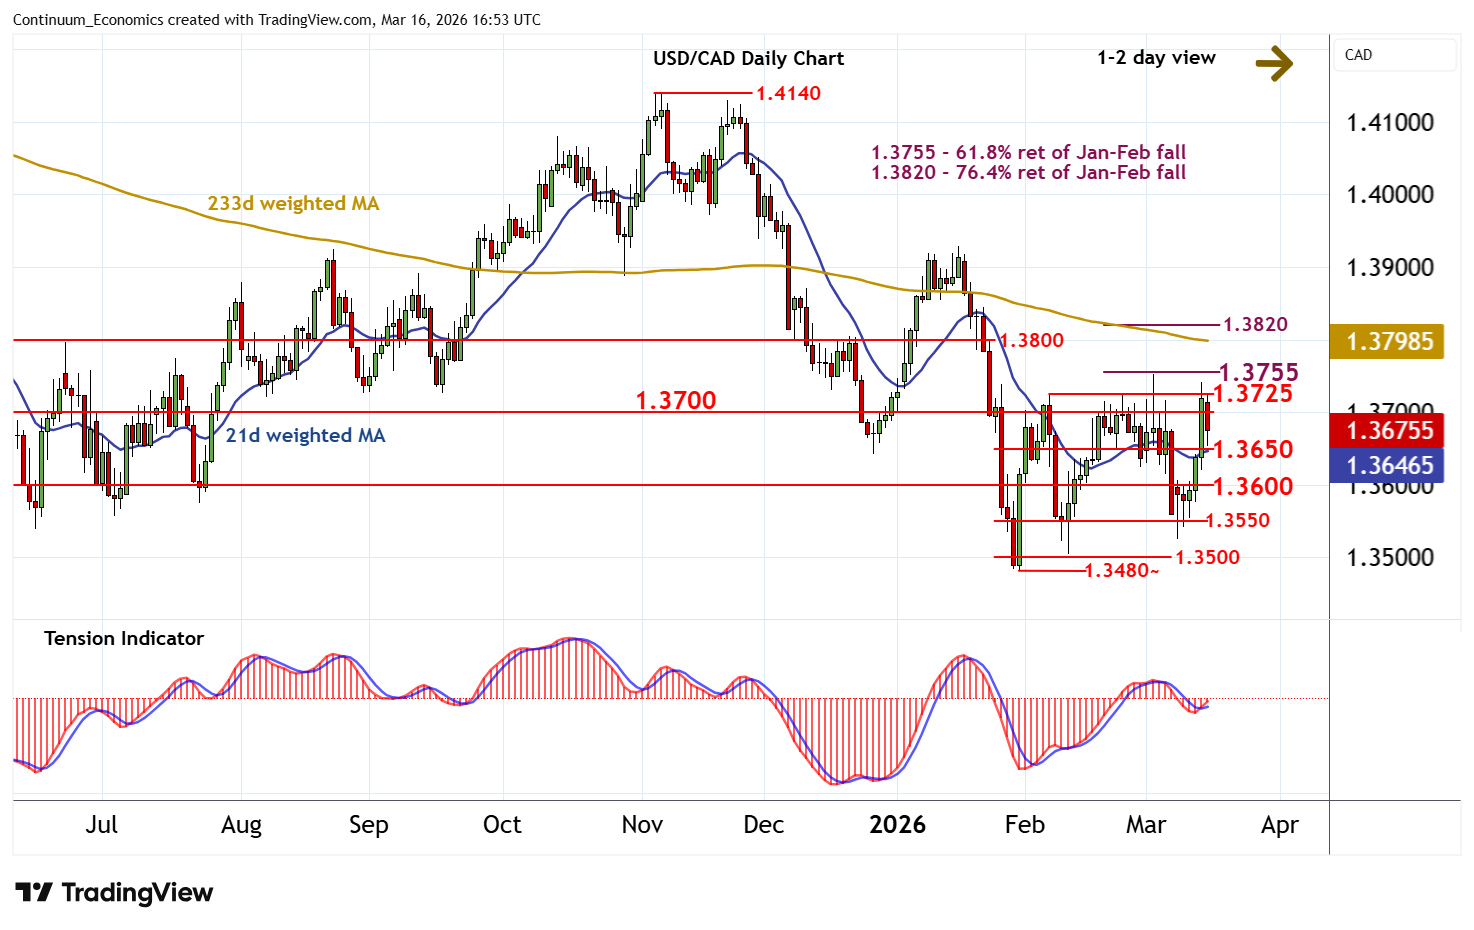
The test of resistance within congestion around 1.3700 and the 1.3725 monthly high of 6 February has given way to a pullback
| Levels | Imp | Comment | Levels | Imp | Comment | |||
|---|---|---|---|---|---|---|---|---|
| R4 | 1.3800 | * | congestion | S1 | 1.3650 | congestion | ||
| R3 | 1.3755 | ** | 61.8% ret of Jan-Feb fall | S2 | 1.3600 | * | congestion | |
| R2 | 1.3725 | * | 6 Feb (m) high | S3 | 1.3550 | congestion | ||
| R1 | 1.3700 | * | congestion | S4 | 1.3500 | ** | congestion |
Asterisk denotes strength of level
16:25 GMT - The test of resistance within congestion around 1.3700 and the 1.3725 monthly high of 6 February has given way to a pullback, as intraday studies turn down, with prices reaching congestion support at 1.3650. A test beneath here cannot be ruled out. But rising daily readings and improving weekly charts should limit any break in renewed buying interest above further congestion around 1.3600. Meanwhile, resistance remains at 1.3700/25. However, a close above the 1.3755 Fibonacci retracement is needed to turn sentiment positive and extend late-January gains towards 1.3800/20.