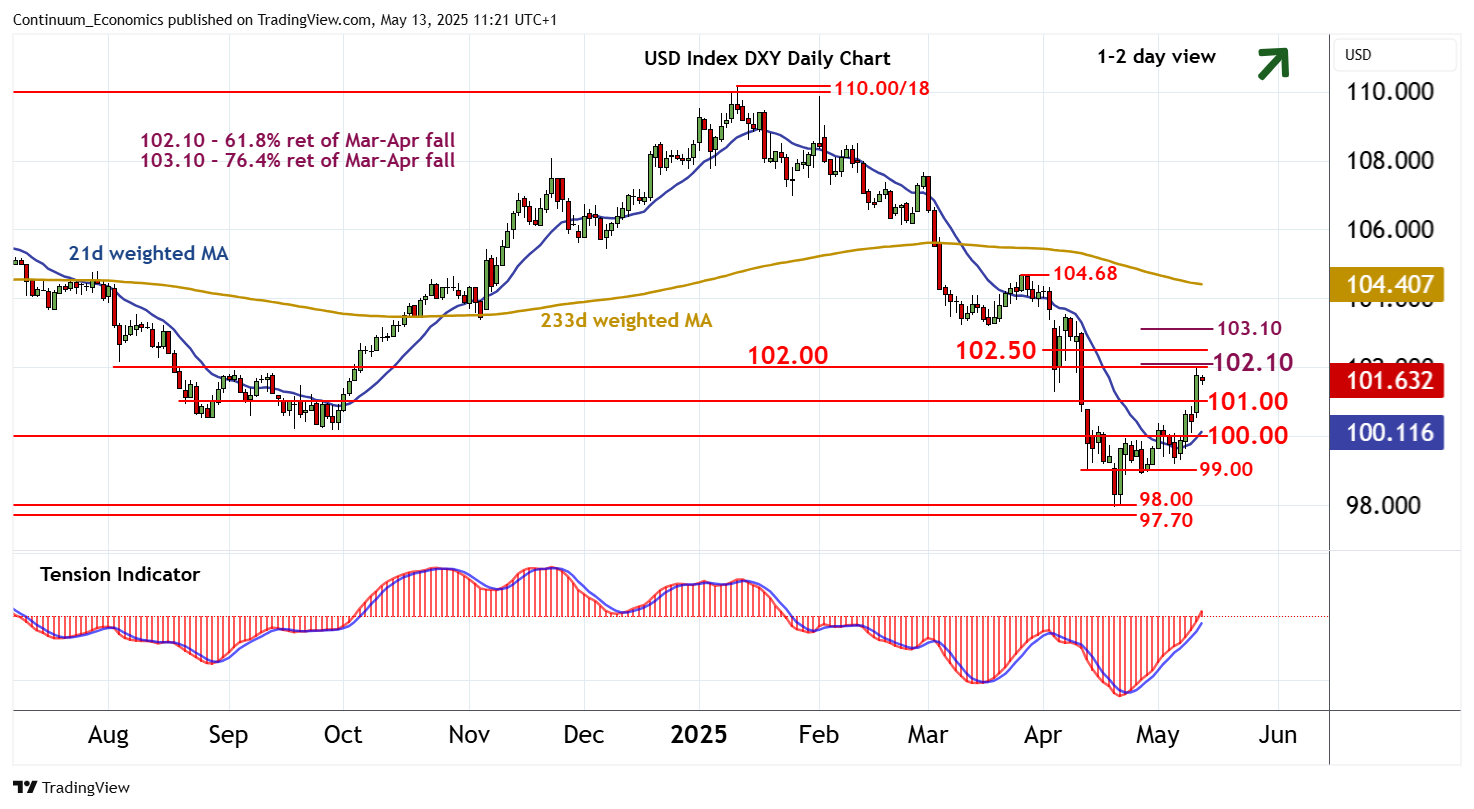
Chart USD Index DXY Update: Consolidating gains - background remains positive

The anticipated test of resistance at the 102.00 break level and the 102.10 Fibonacci retracement has been pushed back from 101.97
| Levels | Imp | Comment | Levels | Imp | Comment | |||
|---|---|---|---|---|---|---|---|---|
| R4 | 103.10 | ** | 76.4% ret of Mar-Apr fall | S1 | 101.00 | * | break level | |
| R3 | 102.50 | * | congestion | S2 | 100.00 | ** | congestion | |
| R2 | 102.10 | ** | 61.8% ret of Mar-Apr fall | S3 | 99.00 | break level | ||
| R1 | 102.00 | ** | break level | S4 | 98.00 | * | congestion |
Asterisk denotes strength of level
11:10 BST - The anticipated test of resistance at the 102.00 break level and the 102.10 Fibonacci retracement has been pushed back from 101.97, as intraday studies turn down, with prices currently trading around 101.65. Overbought daily stochastics are also flattening, suggesting room for consolidation in the coming sessions. However, the positive daily Tension Indicator and rising weekly charts are expected to prompt later gains. A close above 102.00/10 will turn sentiment positive and extend April gains initially to congestion around 102.50. Meanwhile, support remains at 101.00. An unexpected close beneath here will turn sentiment neutral and give way to consolidation above congestion around 100.00.