Published: 2025-08-28T06:04:34.000Z
Chart USD/IDR Updates: Extending gains
0
-
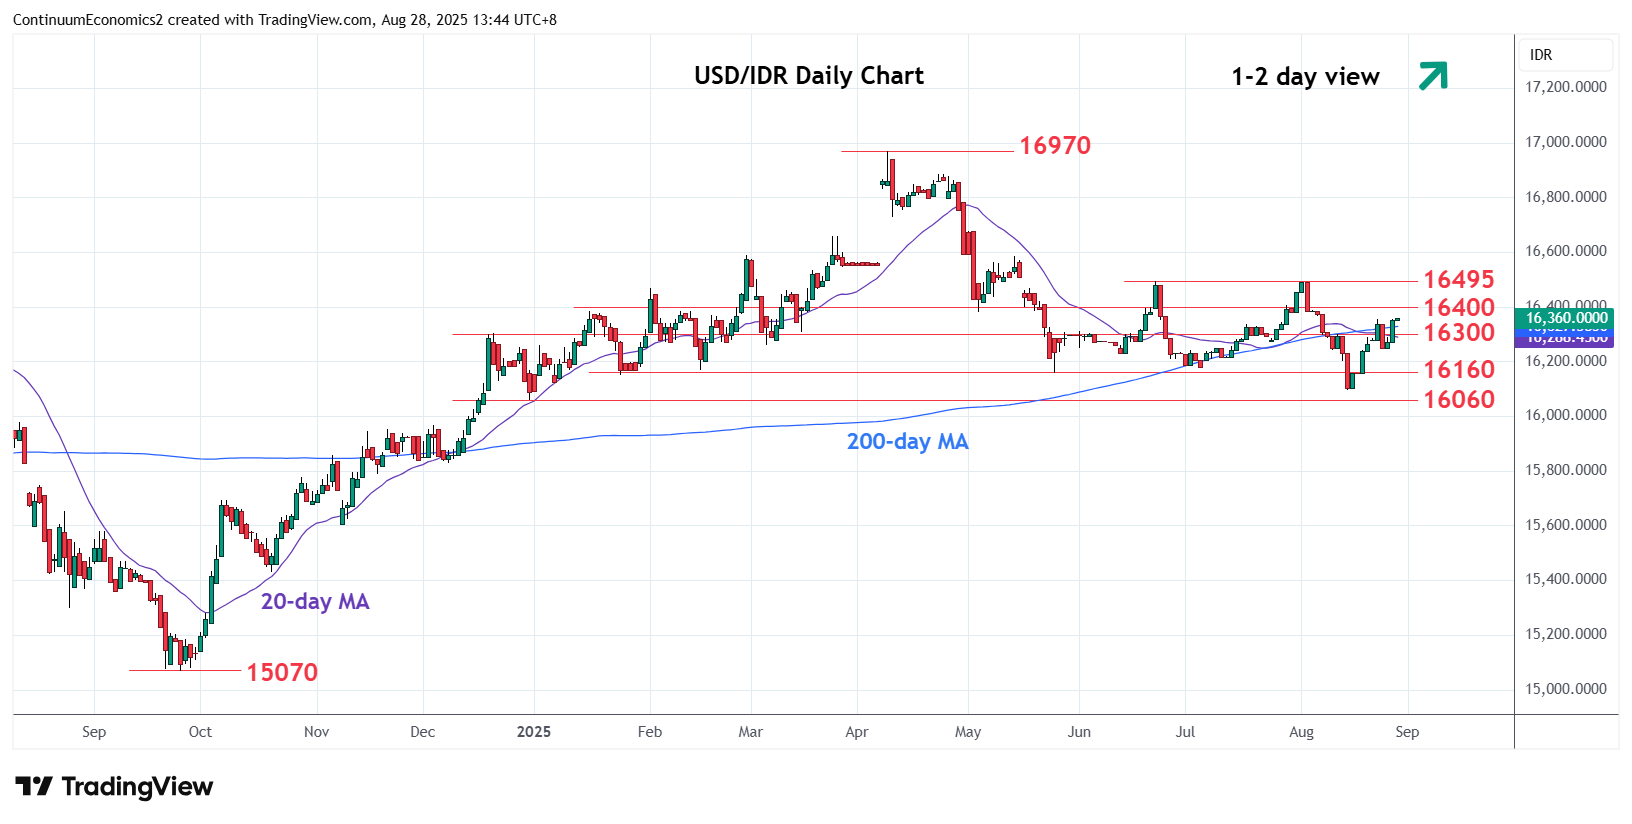
Extending gains from the 16095 low as break above the 16355 high see room for stronger gains to 16400 congestion then the 16490/16495 highs
| Levels | Imp | Comment | Levels | Imp | Comment | |||
|---|---|---|---|---|---|---|---|---|
| R4 | 16635 | * | 61.8% Apr/Aug fall | S1 | 16250 | * | 25 Aug low | |
| R3 | 16585 | * | 14 May high | S2 | 16160 | * | May low, congestion | |
| R2 | 16490/95 | ** | 1 Aug, Jun highs | S3 | 16095 | ** | 14 Aug YTD low | |
| R1 | 16400 | * | congestion | S4 | 16060 | * | 31 Dec low |
Asterisk denotes strength of level
06:00 GMT - Extending gains from the 16095 low as break above the 16355 high see room for stronger gains to resistance at the 16400 congestion then the 16490/16495 highs. Clearance here will further retrace the April/August losses and see room to the 16585 resistance and 16635, 61.8% Fibonacci level. Corrective gains are expected to give way to renewed selling pressure later and break of the 16250 support will expose support at 16160 and 16095 lows to retest. Below this will see deeper pullback to support at the 16000/15970 area.