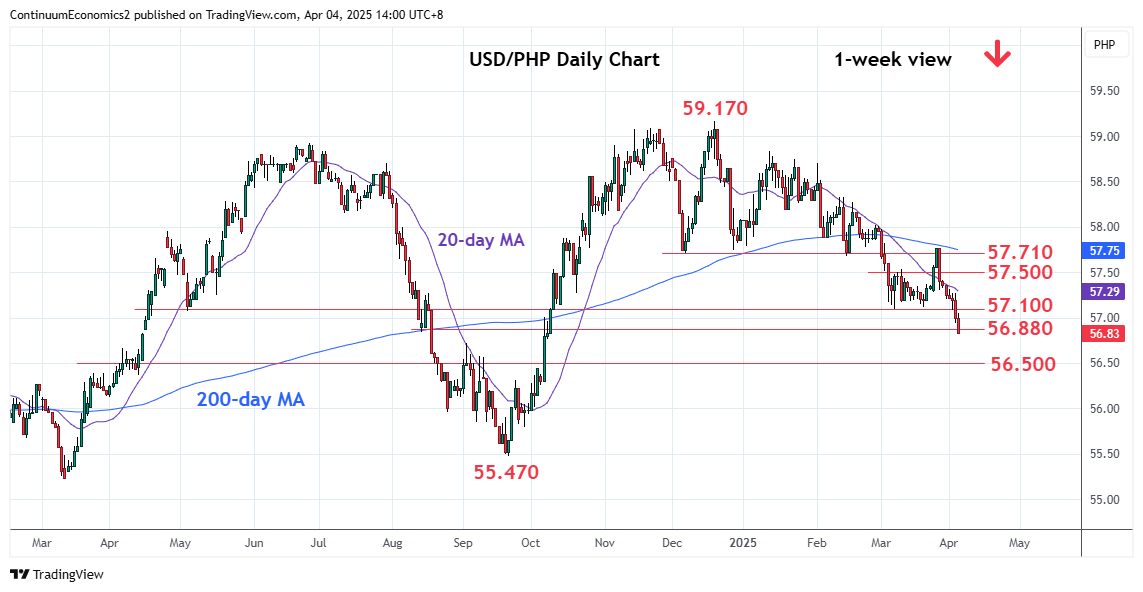
Pressure remains on the downside to extend break of the 57.100 support through the 56.880, 61.8% Fibonacci level

| Level | Comment | Level | Comment | |||||
|---|---|---|---|---|---|---|---|---|
| R4 | 57.710 | ** | Dec low, congestion | S1 | 56.760 | * | 8 Oct low | |
| R3 | 57.500 | * | congestion | S2 | 56.500 | * | congestion | |
| R2 | 57.310 | * | 27 Mar low | S3 | 56.440 | * | 3 Oct high | |
| R1 | 57.100 | * | 7 Mar low | S4 | 56.310 | * | 24 Sep high |
Asterisk denotes strength of level
06:10 GMT - Pressure remains on the downside to extend break of the 57.100 support through the 56.880, 61.8% Fibonacci level. Below this see room for deeper pullback to retrace the September/December rally to the 56.760 support then the 56.500 congestion. However, the deep oversold intraday and daily studies caution corrective bounce with the March low at 57.100 now turned resistance expected to cap. Lift over this will ease the downside pressure and see room for stronger gains to retrace losses from the 57.770 high of last week.