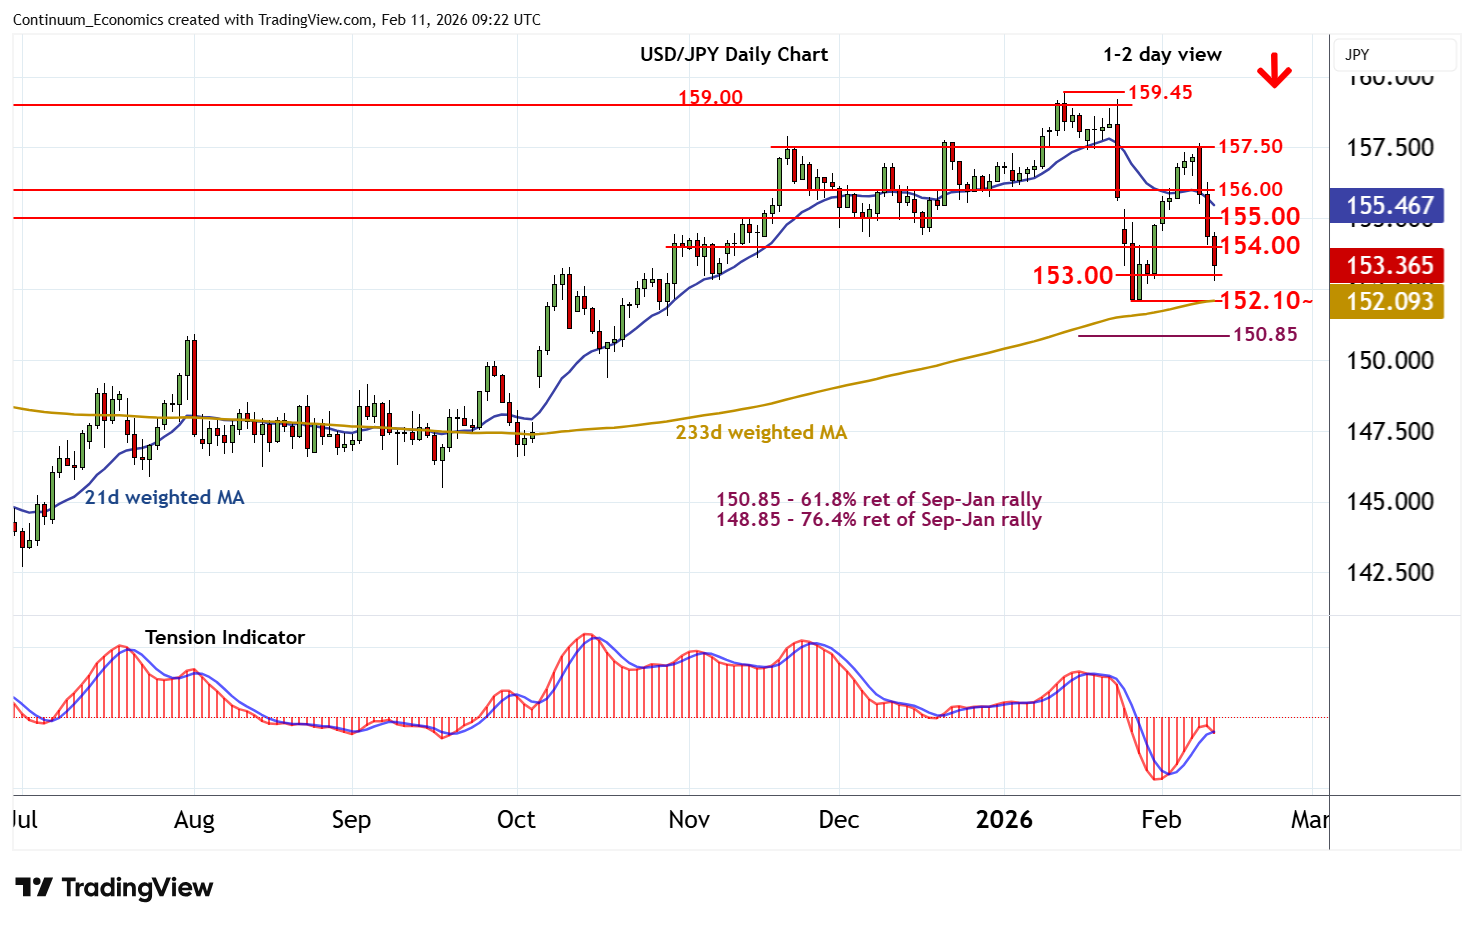
Chart USD/JPY Update: Extending losses
Anticipated losses have tested below congestion support at 153.00
| Levels | Imp | Comment | Levels | Imp | Comment | |||
|---|---|---|---|---|---|---|---|---|
| R4 | 157.50 | * | congestion | S1 | 153.00 | congestion | ||
| R3 | 156.00 | * | congestion | S2 | 152.10~ | ** | 27 Jan YTD low | |
| R2 | 155.00 | * | break level | S3 | 150.85 | ** | 61.8% ret of Sep-Jan rally | |
| R1 | 154.00 | * | congestion | S4 | 150.00 | ** | break level |
Asterisk denotes strength of level
09:15 GMT - Anticipated losses have tested below congestion support at 153.00, with prices reaching 152.80 before bouncing back above 153.00. Oversold intraday studies are flat, suggesting room for minor consolidation above 153.00. But daily readings are bearish and broader weekly charts are under pressure, highlighting room for further losses in the coming sessions. A break back below 153.00 will open up critical support at the 152.10~ current year low of 27 January. Extension beneath here will confirm a near-term top in place at the 159.45 current year high of 14 January, as focus then turns to the 150.85 Fibonacci retracement. Meanwhile, resistance is lowered to congestion around 154.00. A close above here, if seen, will help to stabilise price action and prompt consolidation beneath 155.00.