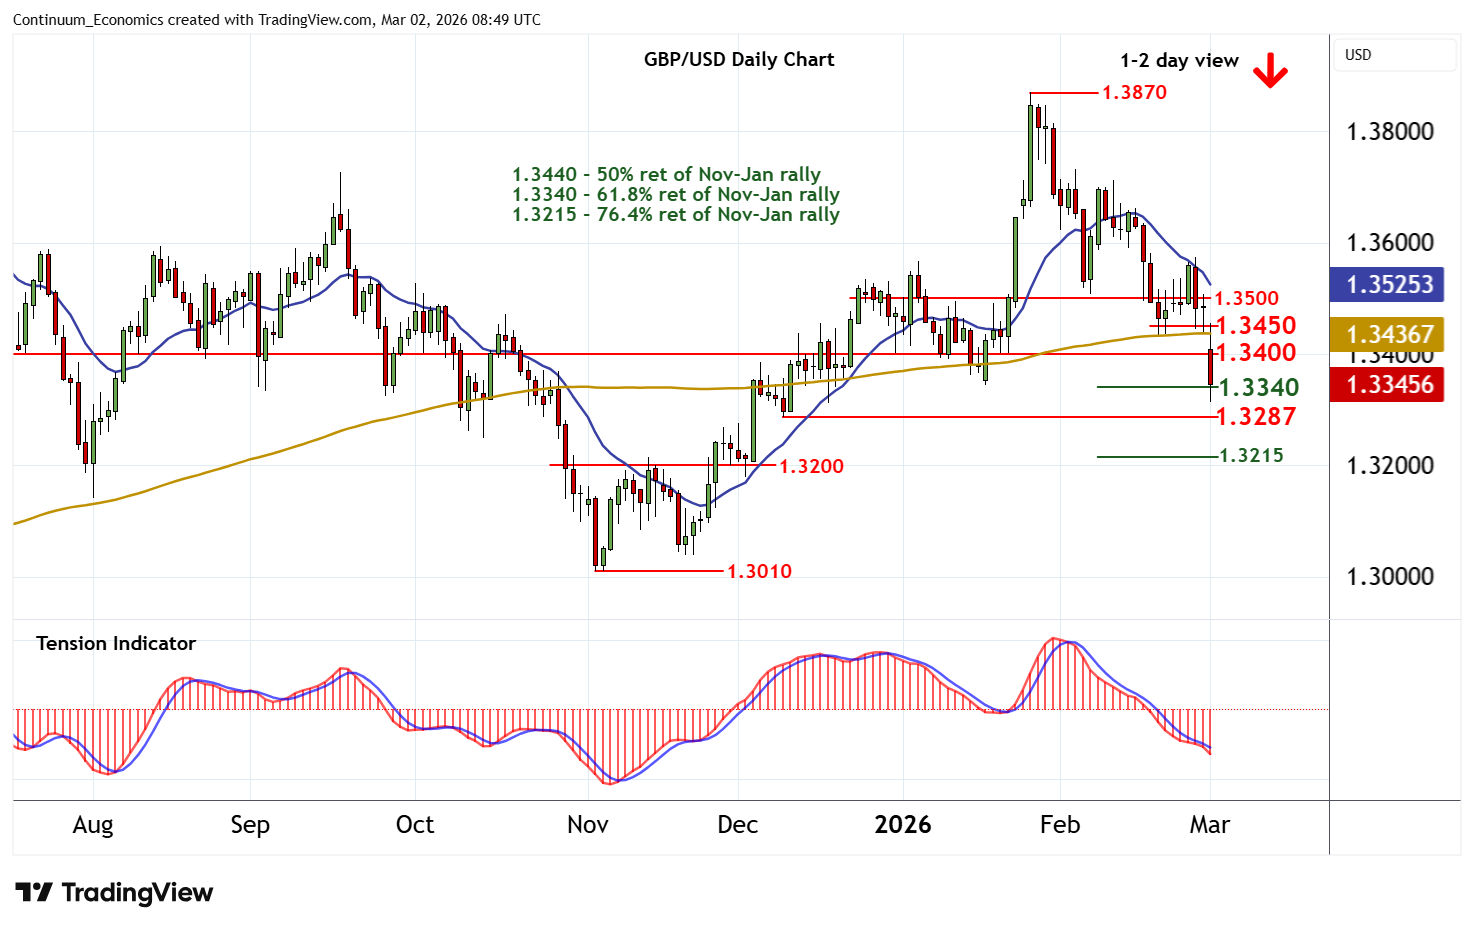
Chart GBP/USD Update: Under pressure
Anticipated losses have tested below the 1.3340 Fibonacci retracement to reach 1.3315~
| Level | Comment | Level | Comment | |||||
|---|---|---|---|---|---|---|---|---|
| R4 | 1.3600 | * | congestion | S1 | 1.3340 | ** | 61.8% ret of Nov-Jan rally | |
| R3 | 1.3500 | ** | congestion | S2 | 1.3300 | * | congestion | |
| R2 | 1.3450 | ** | congestion | S3 | 1.3287 | * | 9 Dec (w) low | |
| R1 | 1.3400 | ** | congestion | S4 | 1.3200/15 | ** | congestion; 76.4% ret |
Asterisk denotes strength of level
08:10 GMT - Anticipated losses have tested below the 1.3340 Fibonacci retracement to reach 1.3315~, where a minor bounce is pushing prices back above 1.3340. Intraday studies are bearish and daily readings are under pressure, highlighting room for still deeper losses. A break back below 1.3340 will open up congestion around 1.3300. Beneath here is the 1.3287 weekly low of 9 December. Bearish weekly charts highlight potential for continuation beneath here towards 1.3200/15. Meanwhile, resistance is lowered to congestion around 1.3400. A close above here, if seen, will help to stabilise price action and prompt consolidation beneath further congestion around 1.3450.