Published: 2026-01-28T01:29:42.000Z
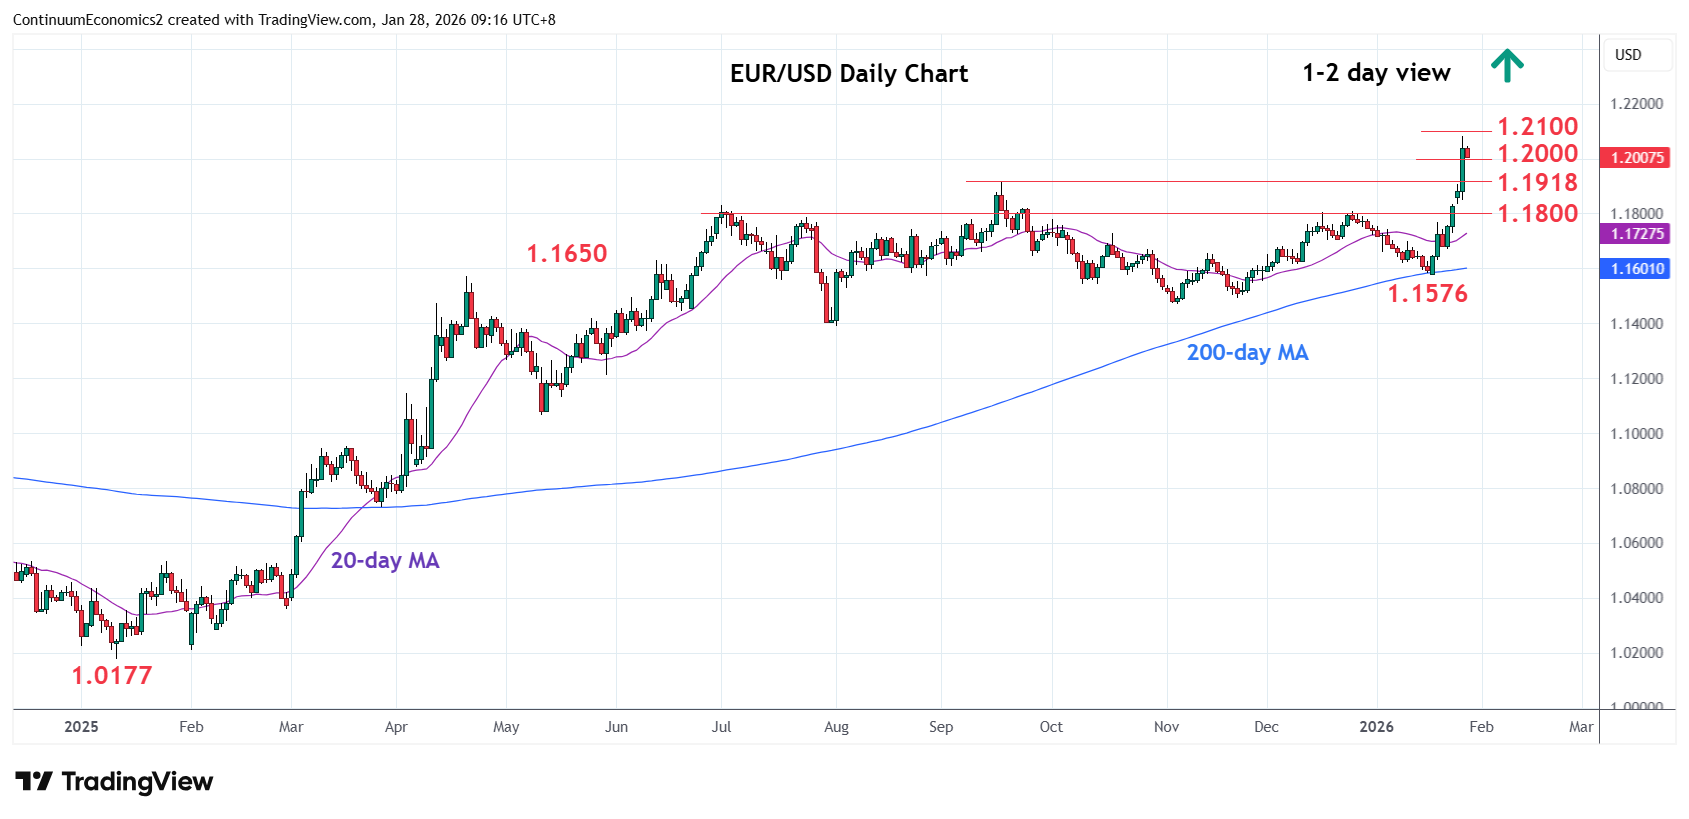
Chart EUR/USD Update: Consolidating gains to 1.2083 high
2
Break above the 1.1918, September 2025 year high, saw sharp rally through the 1.2000 figure to reach fresh high at 1.2083
| Levels | Imp | Comment | Levels | Imp | Comment | |||
|---|---|---|---|---|---|---|---|---|
| R4 | 1.2266 | ** | May 2021 high | S1 | 1.2000 | * | figure | |
| 14 | 1.2200 | * | congestion | S2 | 1.1918 | ** | Sep 2025 year high | |
| R2 | 1.2100/50 | * | congestion | S3 | 1.1833 | * | 23 Jan high, gap | |
| R1 | 1.2083 | * | 27 Jan YTD high | S4 | 1.1800 | ** | congestion |
Asterisk denotes strength of level
01:20 GMT - Break above the 1.1918, September 2025 year high, saw sharp rally through the 1.2000 figure to reach fresh high at 1.2083. Consolidation here see prices unwinding overbought intraday studies but bullish momentum keep pressure on the upside. Higher will see room for extension to 1.2100/1.2150 congestion and 1.2200 level. Support is raised to the 1.2000 level while below this will open up room for deeper pullback to support at the 1.1918, 2025 year high. The latter now expected to underpin and sustain strong gains from the 1.1576 low of last week.