Published: 2026-02-23T07:27:10.000Z
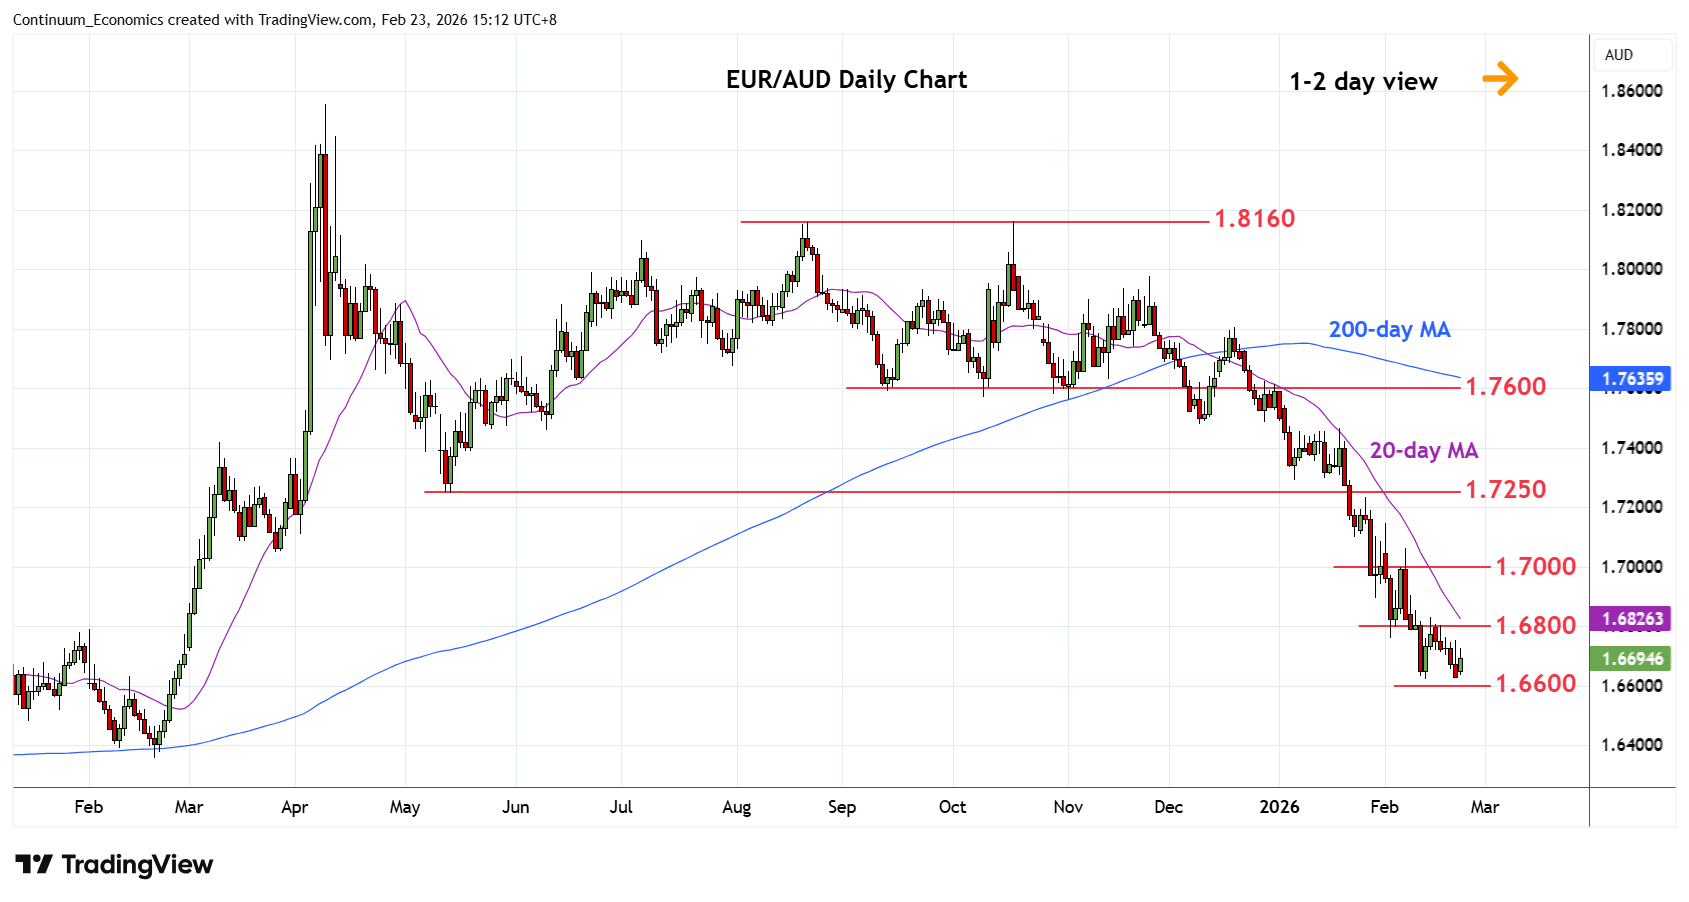
Chart EUR/AUD Update: Consolidating at 1.6625 low
3
Steadied at the 1.6625 low as prices unwind oversold intraday and daily studies
| Levels | Imp | Comment | Levels | Imp | Comment | |||
|---|---|---|---|---|---|---|---|---|
| R4 | 1.7100 | * | 23 Jan low | S1 | 1.6625/00 | * | 12 Feb low, congestion | |
| R3 | 1.7000 | * | figure, congestion | S2 | 1.6500 | * | congestion | |
| R2 | 1.6900 | * | congestion | S3 | 1.6400 | * | figure, congestion | |
| R1 | 1.6800 | * | congestion | S4 | 1.6357 | ** | Feb 2025 year low |
Asterisk denotes strength of level
07:15 GMT - Steadied at the 1.6625 low as prices unwind oversold intraday and daily studies. Bounce see resistance starting at 1.6800 level and lift over this needed to ease the downside pressure and clear the way for stronger gains to retrace losses from the January high. Break will see room for stronger corrective gains to the 1.6900 level and 1.7000 figure. Meanwhile, support at the 1.6625/00 low and congestion area should underpin. A later break here will further extend losses from the April 2025 year high to the 1.6500/1.6400 area.