Published: 2026-02-18T14:50:18.000Z
Chart USD/ZAR Update: Edging higher in choppy trade
3
Little change
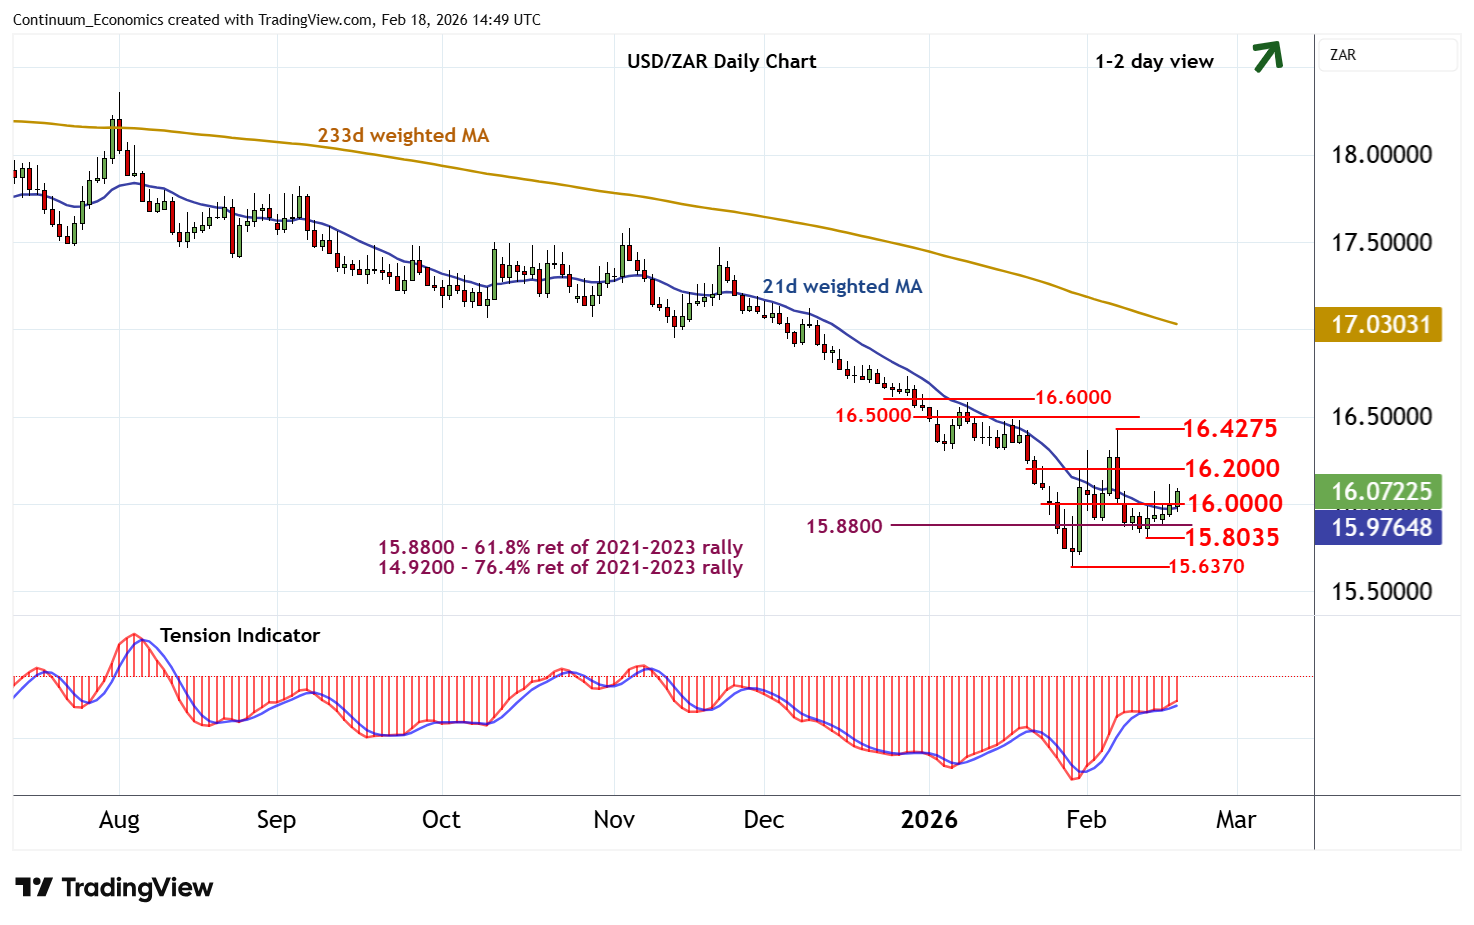
| Level | Comment | Level | Comment | |||||
|---|---|---|---|---|---|---|---|---|
| R4 | 16.6000 | break level | S1 | 16.0000 | ** | congestion | ||
| R3 | 16.5000 | break level | S2 | 15.8035 | * | 12 Feb (w) low | ||
| R2 | 16.4275 | * | 6 Feb (w) high | S3 | 15.6370 | ** | 29 Jan YTD low | |
| R1 | 16.2000 | minor congestion | S4 | 15.1665 | * | June 2022 low |
Asterisk denotes strength of level
14:45 GMT - Little change, as prices extend cautious trade following the test below congestion support at 16.0000. Daily readings are rising, highlighting room for a test of congestion resistance at 16.2000. But mixed weekly charts are expected to limit any immediate break in fresh consolidation beneath 16.5000. Meanwhile, support remains at 16.0000. However, any immediate tests beneath here should give way to consolidation above the 15.0835 weekly low of 12 February.