Chart USD/JPY Update: Lower into consolidation
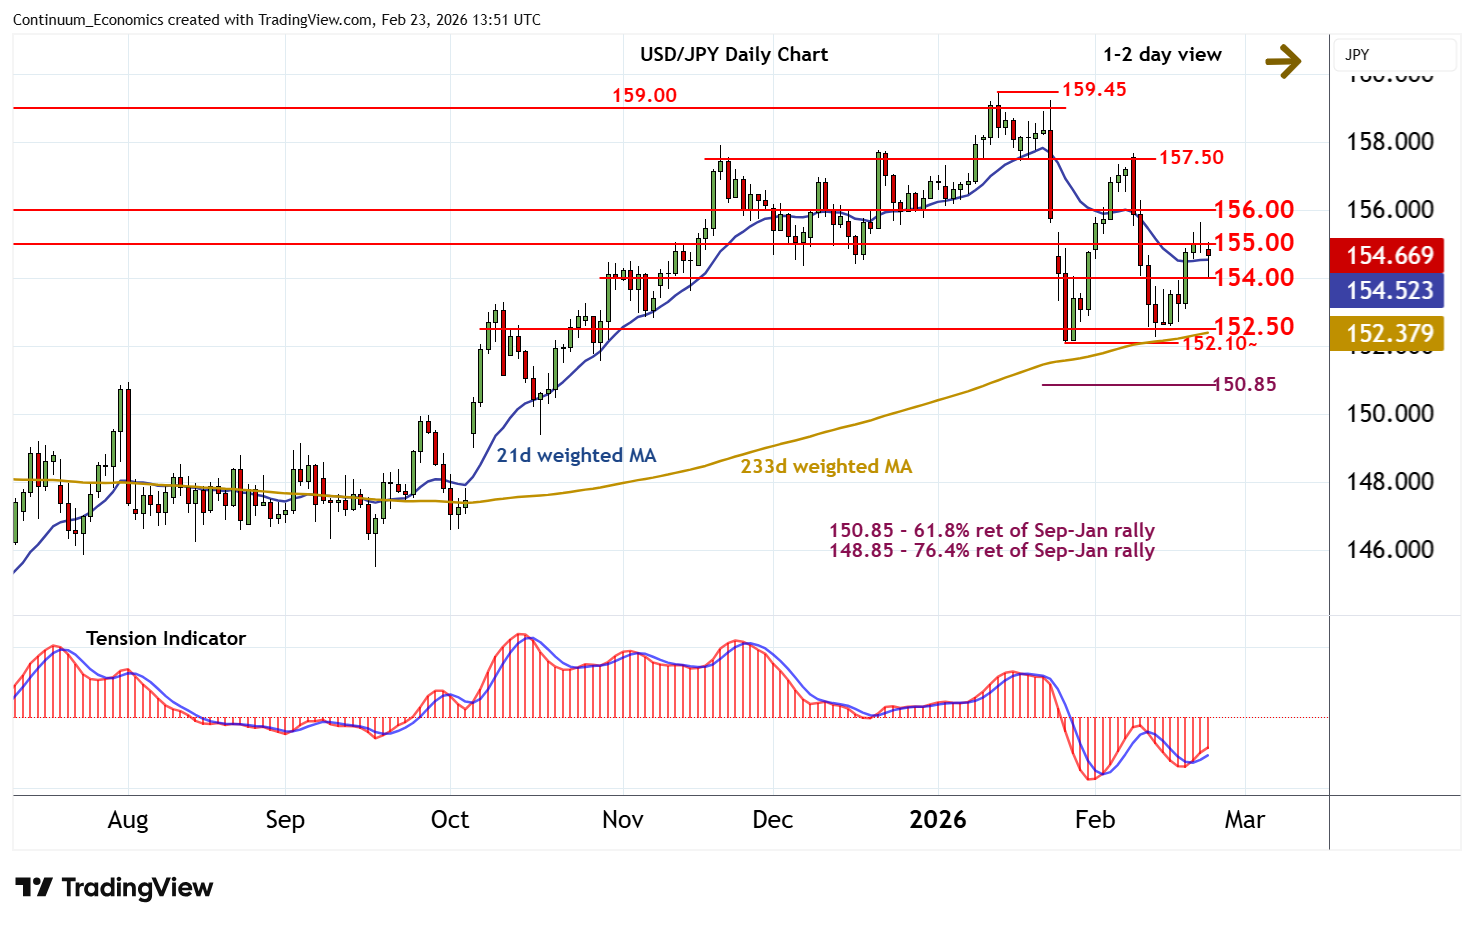
Consolidation beneath the 155.65 weekly high of 20 February has given way to a pullback to congestion support at 154.00
| Levels | Imp | Comment | Levels | Imp | Comment | |||
|---|---|---|---|---|---|---|---|---|
| R4 | 157.50 | * | congestion | S1 | 154.00 | * | congestion | |
| R3 | 156.00 | * | congestion | S2 | 152.50 | * | congestion | |
| R2 | 155.65 | * | 20 Feb (w) high | S3 | 152.10~ | ** | 27 Jan YTD low | |
| R1 | 155.00 | * | break level | S4 | 150.85 | ** | 61.8% ret of Sep-Jan rally |
Asterisk denotes strength of level
13:35 GMT - Consolidation beneath the 155.65 weekly high of 20 February has given way to a pullback to congestion support at 154.00. Unwinding oversold intraday studies are prompting a bounce back to 154.60. The daily Tension Indicator is rising, suggesting room for a retest of resistance at 155.00. But positive daily stochastics are flattening and broader weekly charts are turning lower once again, suggesting any immediate tests could give way to renewed selling interest. In the coming sessions, cautious trade is looked for, before fresh losses unfold. A break below 154.00 will add weight to sentiment. But a further close below critical support within the 152.10~/50 range is needed to turn sentiment negative and confirm continuation of January losses.