Chart USD Index DXY Update: Consolidating - studies rising
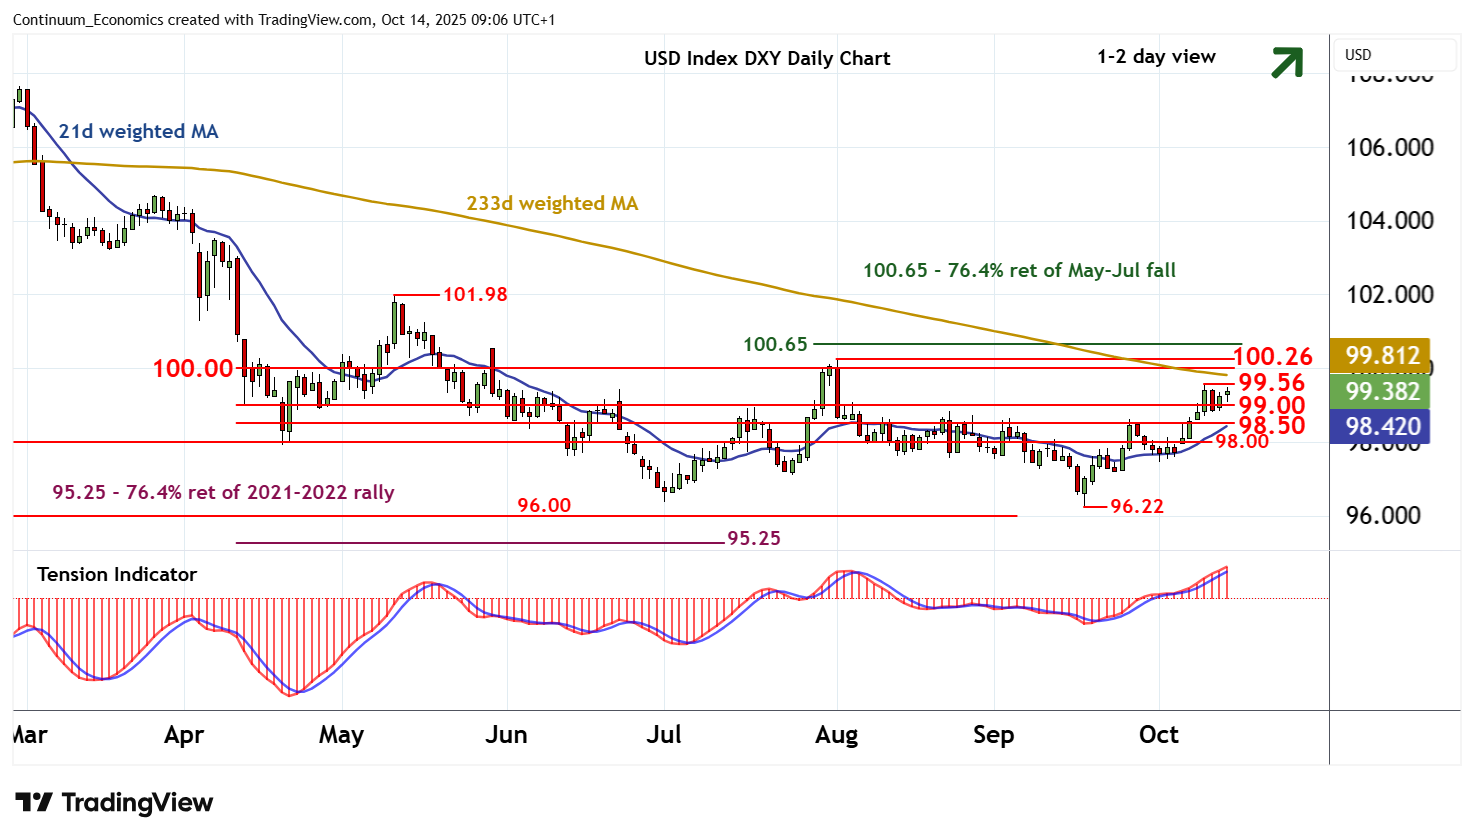
Little change, as prices extend cautious trade beneath resistance at the 99.56 weekly high of 9 October
| Levels | Imp | Comment | Levels | Imp | Comment | |||
|---|---|---|---|---|---|---|---|---|
| R4 | 100.65 | ** | 76.4% ret of May-Jul fall | S1 | 99.00 | * | congestion | |
| R3 | 100.26 | ** | 1 Aug (m) high | S2 | 98.50 | congestion | ||
| R2 | 100.00 | ** | congestion | S3 | 98.00 | * | congestion | |
| R1 | 99.56 | * | 9 Oct (w) high | S4 | 97.50 | * | congestion |
Asterisk denotes strength of level
09:00 BST - Little change, as prices extend cautious trade beneath resistance at the 99.56 weekly high of 9 October. Overbought daily stochastics continue to unwind, suggesting any immediate tests could be limited in fresh consolidation. But the rising daily Tension Indicator and positive weekly charts highlight room for a later break. A close above here will open up strong resistance at congestion around 100.00 and the 100.26 monthly high of 1 August. Meanwhile, support remains at congestion around 99.00. Any tests beneath here should be limited in renewed buying interest above further congestion around 98.50.