Published: 2025-08-01T14:00:57.000Z
Chart USD Index DXY Update: Sharp pullback from 100.00

Senior Technical Strategist
3
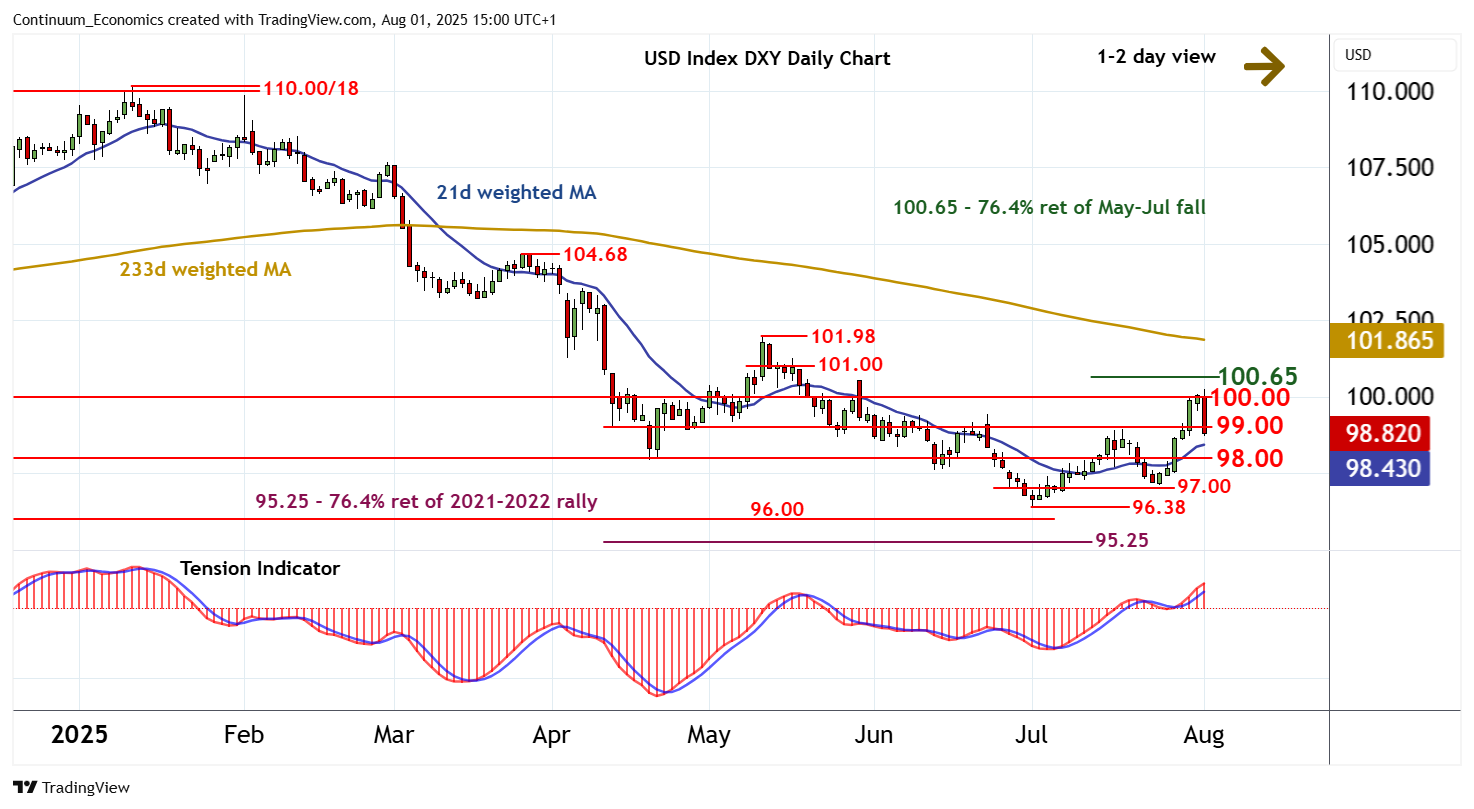
Cautious trade around 100.00 has given way to a sharp pullback
| Levels | Imp | Comment | Levels | Imp | Comment | |||
|---|---|---|---|---|---|---|---|---|
| R4 | 101.00 | congestion | S1 | 99.00 | * | break level | ||
| R3 | 100.65 | ** | 76.4% ret of May-Jul fall | S2 | 98.00 | * | congestion | |
| R2 | 100.54 | ** | 29 May (w) high | S3 | 97.00 | * | congestion | |
| R1 | 100.00 | ** | congestion | S4 | 96.50 | * | congestion |
Asterisk denotes strength of level
14:50 BST - Cautious trade around 100.00 has given way to a sharp pullback, with prices currently trading around support at 99.00. Intraday studies have turned down, unwinding negative divergence, and overbought daily stochastics are also coming under pressure, highlighting room for deeper losses. A break below 99.00 will open up congestion support at 98.00. But the positive daily Tension Indicator and rising weekly charts should limit any initial tests in consolidation. Meanwhile, a close above 100.00 is needed to turn sentiment positive and extend July gains towards the 100.65 Fibonacci retracement.