Published: 2023-12-12T14:09:56.000Z
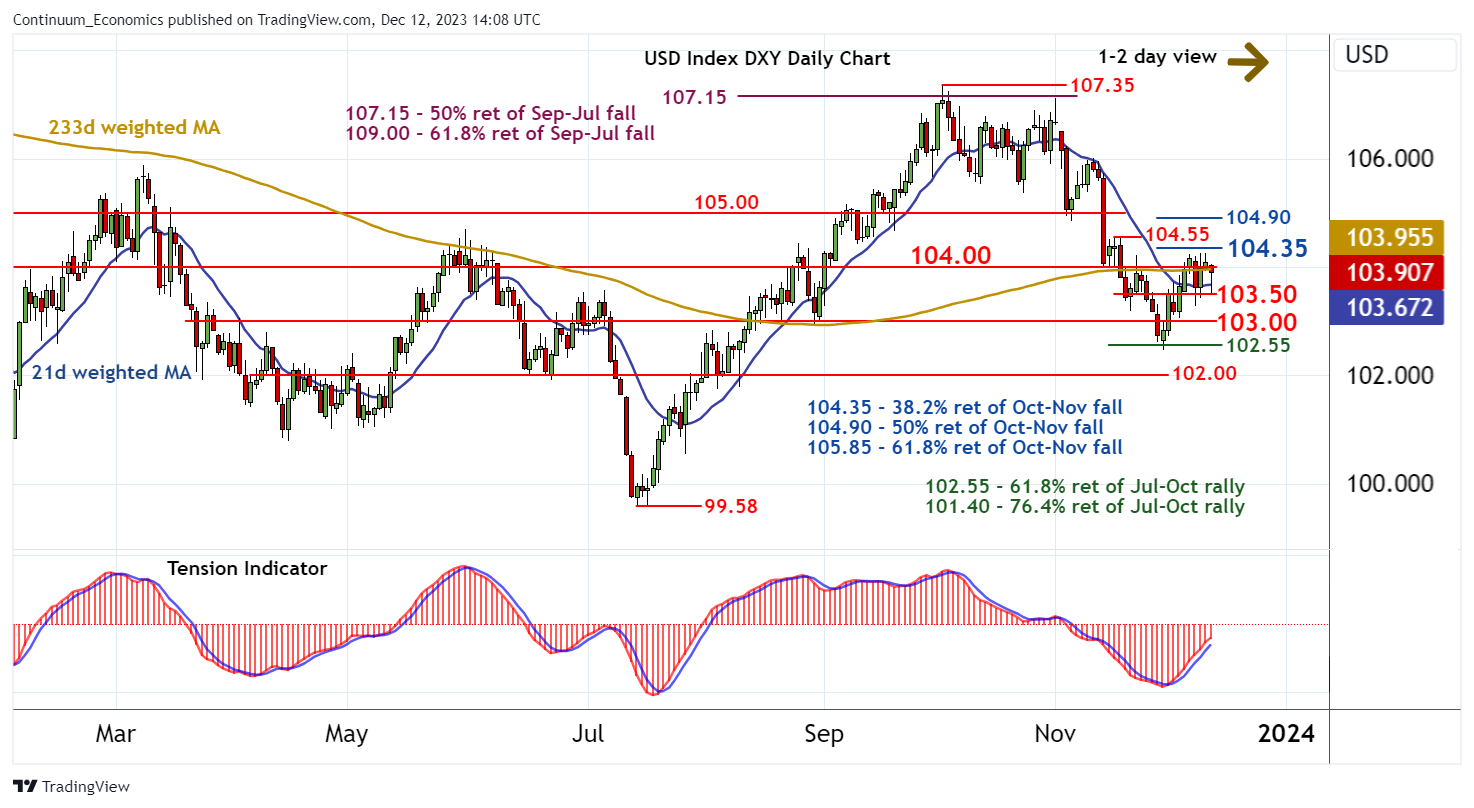
Chart USD Index DXY Update: Choppy beneath 104.00/35 - potential remains for a test above here
-

| Levels | Imp | Comment | Levels | Imp | Comment | |||
|---|---|---|---|---|---|---|---|---|
| R4 | 104.90/00 | ** | 50% ret; break level | S1 | 103.50 | * | break level | |
| R3 | 104.55 | * | 16-17 Nov highs | S2 | 103.00 | * | congestion | |
| R2 | 104.35 | * | 38.2% ret of Oct-Nov fall | S3 | 102.47/55 | ** | 29 Nov (m) low; 61.8% ret | |
| R1 | 104.00 | * | congestion | S4 | 102.00 | ** | congestion |
Asterisk denotes strength of level
14:00 GMT - Consolidation beneath congestion resistance at 104.00 has given way to a test down to 103.50, before bouncing back to once again pressure 104.00. Overbought daily stochastics have ticked higher once again and the daily Tension Indicator is positive, suggesting potential for a renewed break towards resistance at the 104.35 Fibonacci retracement. Continuation towards 104.55 cannot be ruled out, but overbought daily stochastics and mixed/negative weekly charts should limit any further strength to stronger resistance at 104.90/00. Meanwhile, support remains at 103.50. A close beneath here, if seen, will open up congestion around 103.00, where fresh range trade is expected to develop.