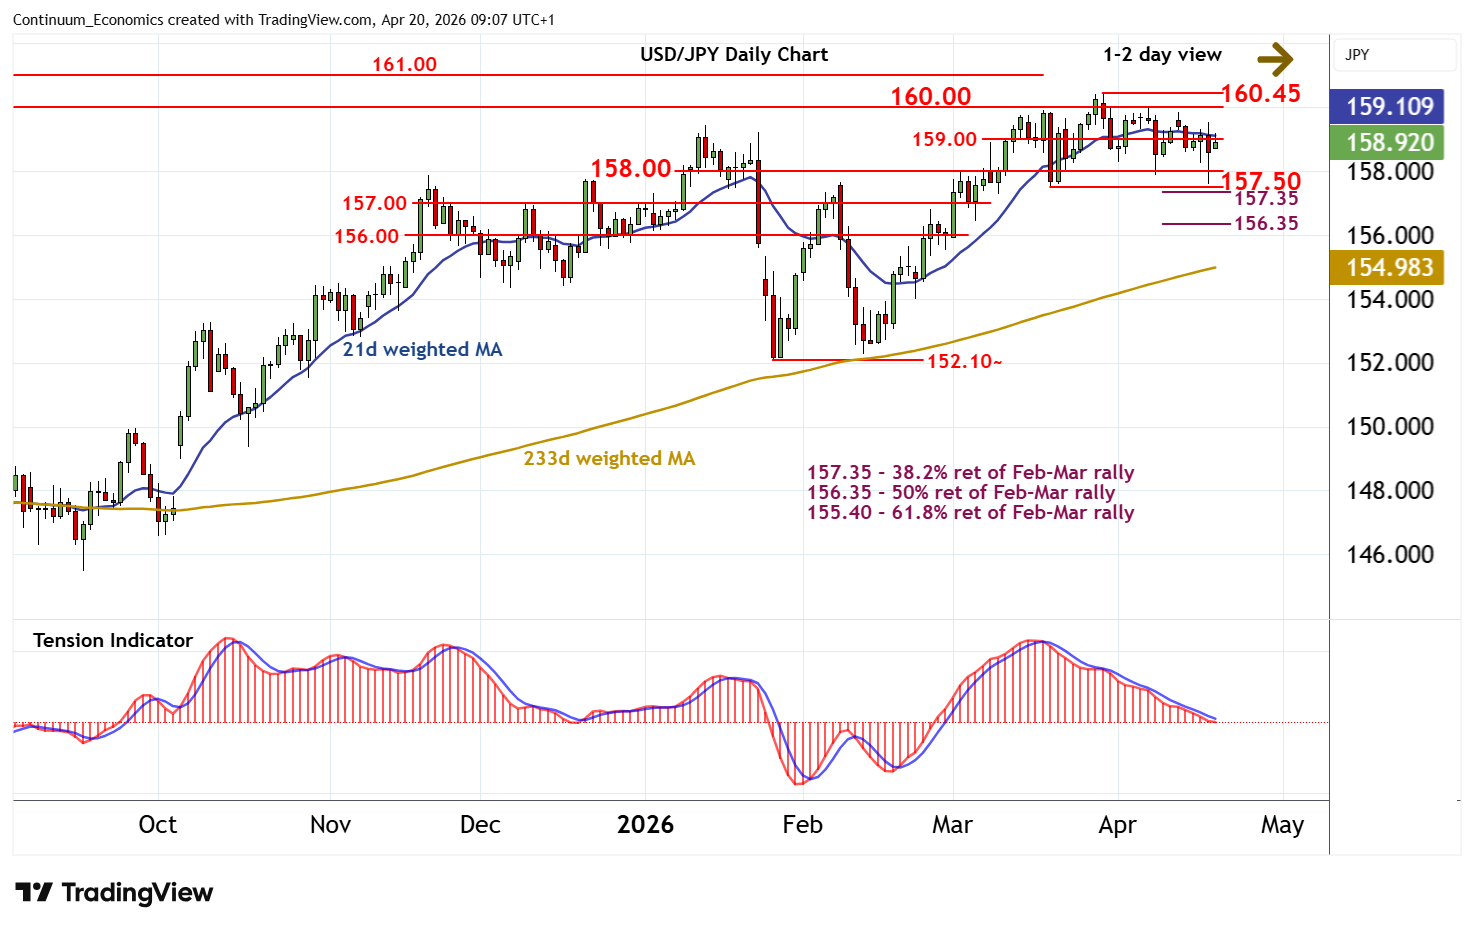
Chart USD/JPY Update: Back in range
Anticipated losses have bounced smartly from above support at the 157.50 weekly low of 19 March
| Levels | Imp | Comment | Levels | Imp | Comment | |||
|---|---|---|---|---|---|---|---|---|
| R4 | 161.00 | * | July 2024 congestion | S1 | 158.00 | ** | congestion | |
| R3 | 160.45 | ** | 30 Mar YTD high | S2 | 157.35/50 | ** | 38.2% ret; 19 Mar (w) low | |
| R2 | 160.00 | ** | historic congestion | S3 | 157.00 | * | congestion | |
| R1 | 159.00 | * | congestion | S4 | 156.35 | ** | 50% ret of Feb-Mar rally |
Asterisk denotes strength of level
09:00 BST - Anticipated losses have bounced smartly from above support at the 157.50 weekly low of 19 March, as intraday studies turn higher, with prices currently trading just below congestion resistance at 159.00. Oversold daily stochastics and the bearish daily Tension Indicator are flattening, suggesting room for a retest above 159.00. But mixed/negative weekly charts should limit initial scope in renewed consolidation beneath 160.00. Meanwhile, support is at congestion around 158.00 and extends to 157.50. A close beneath here, if seen, will add weight to sentiment and extend late-March losses below the 157.35 Fibonacci retracement towards congestion around 157.00.