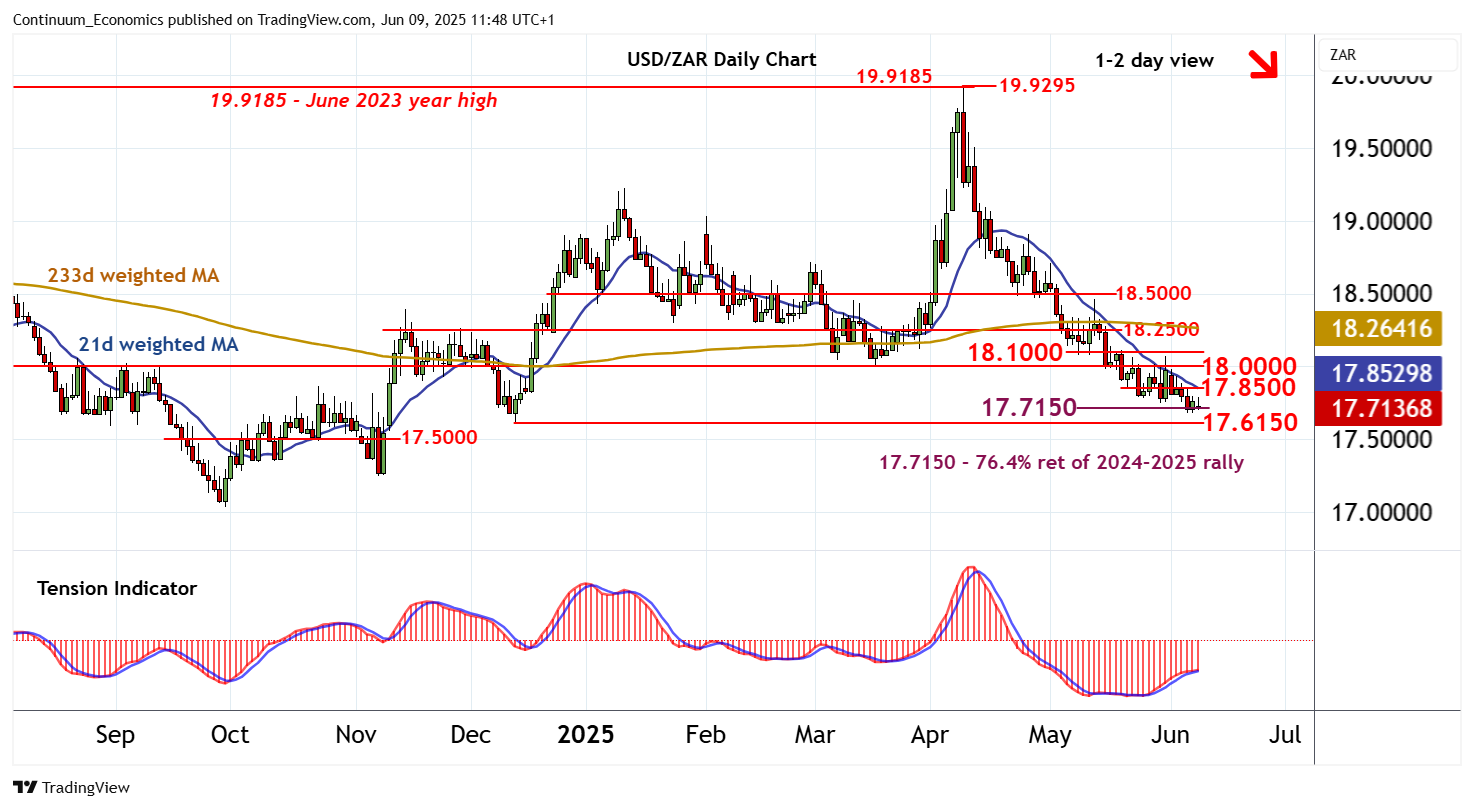
Chart USD/ZAR Update: Cautious trade at the 17.7150 Fibonacci retracement

Still little change, as mixed/negative intraday studies and the flat daily Tension Indicator keep near-term sentiment cautious
| Level | Comment | Level | Comment | |||||
|---|---|---|---|---|---|---|---|---|
| R4 | 18.2500 | * | congestion | S1 | 17.7150 | ** | 76.4% ret of 2024-2025 rally | |
| R3 | 18.1000 | * | break level | S2 | 17.6150 | ** | 12 Dec (m) low | |
| R2 | 18.0000 | ** | congestion | S3 | 17.5000 | * | congestion | |
| R1 | 17.8500 | break level | S4 | 17.2500 | ** | 7 Nov (m) low |
Asterisk denotes strength of level
11:40 BST - Still little change, as mixed/negative intraday studies and the flat daily Tension Indicator keep near-term sentiment cautious and prompt consolidation above strong support at the 17.7150 Fibonacci retracement. Daily stochastics are under pressure and broader weekly charts are leaning lower, highlighting a bearish background and room for still further losses in the coming sessions. A later close beneath here will add weight to sentiment and extend April losses towards the 17.6150 monthly low of 12 December. Meanwhile, resistance is at 17.8500. A close above here, if seen, will open up resistance within 18.0000 - 18.1000, where fresh selling interest is expected to appear.