Published: 2025-11-20T00:23:42.000Z
Chart AUD/USD Update: Under pressure
1
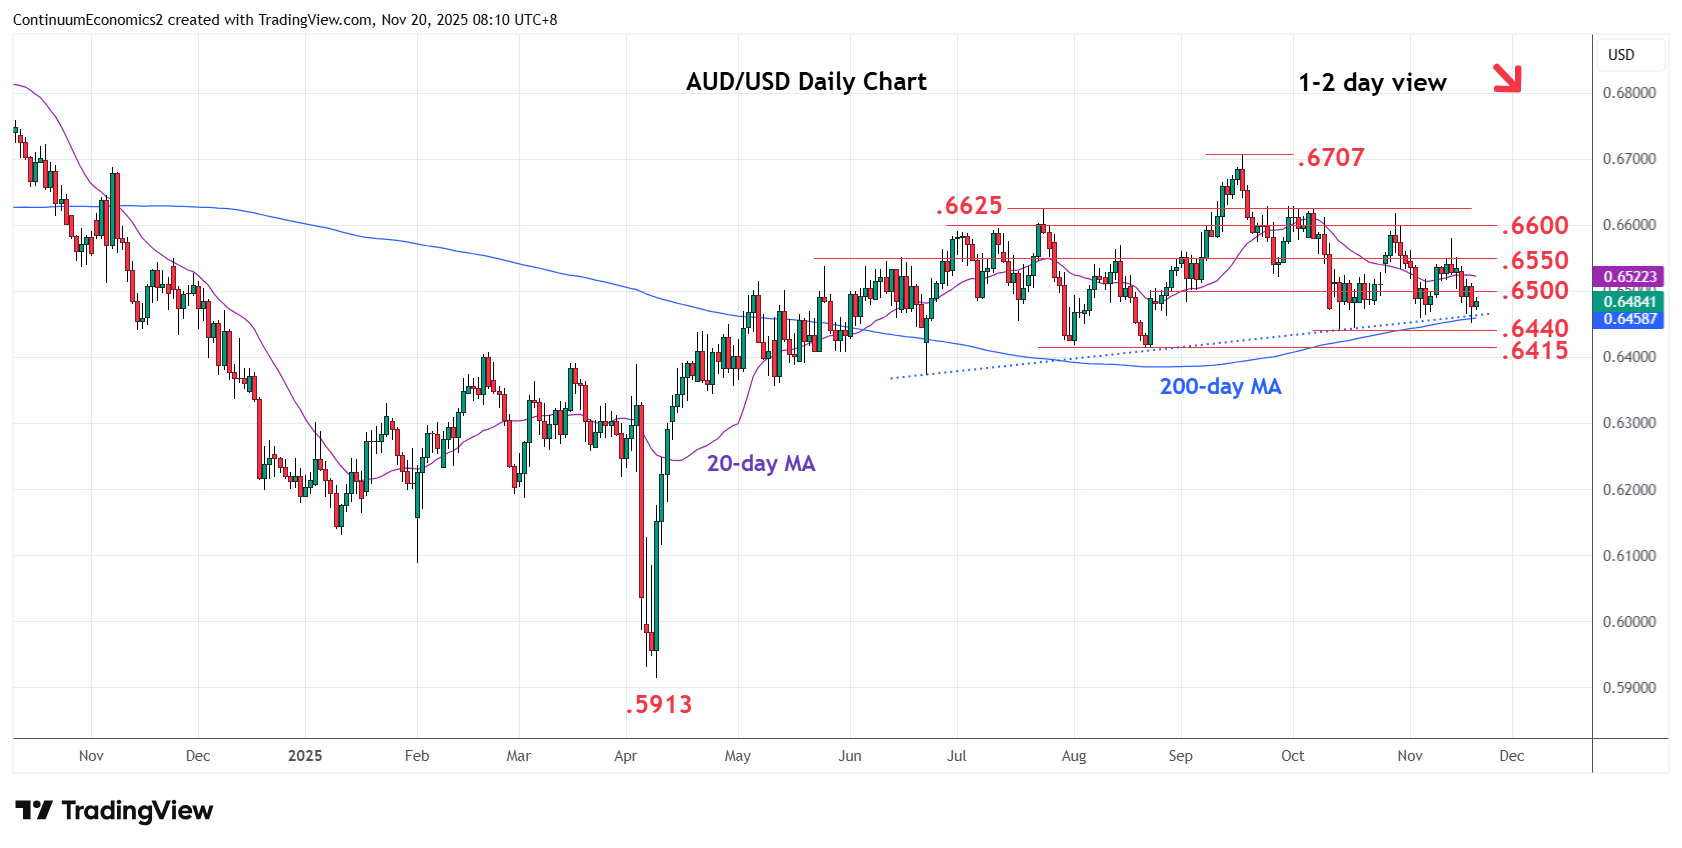
Extending pullback from the .6580 high of last week and trade below the .6500 level see pressure returning to support at the .6458 and .6440 lows
| Levels | Imp | Comment | Levels | Imp | Comment | |||
|---|---|---|---|---|---|---|---|---|
| R4 | 0.6625/30 | ** | Jul, Oct highs | S1 | 0.6440 | ** | Oct low | |
| R3 | 0.6600 | * | congestion | S2 | 0.6415/00 | ** | Aug low, 38.2% | |
| R2 | 0.6550 | * | congestion | S3 | 0.6372 | Jun low | ||
| R1 | 0.6500/20 | * | congestion, 26 Sep low | S4 | 0.6356/50 | * | May low, congestion |
Asterisk denotes strength of level
00:15 GMT - Extending pullback from the .6580 high of last week and trade below the .6500 level see pressure returning to support at the .6458 and .6440 lows. Negative daily and weekly threathens break here to extend the broader losses from .6707 September high to retrace gains from April current year low. Lower will turn focus to the .6415/00 support and 38.2% Fibonacci level. Meanwhile, resistance at the .6500/20 area is expected to cap. Only above here will ease the downside pressure and see room for stronger bounce to retest .6550/80 resistance.