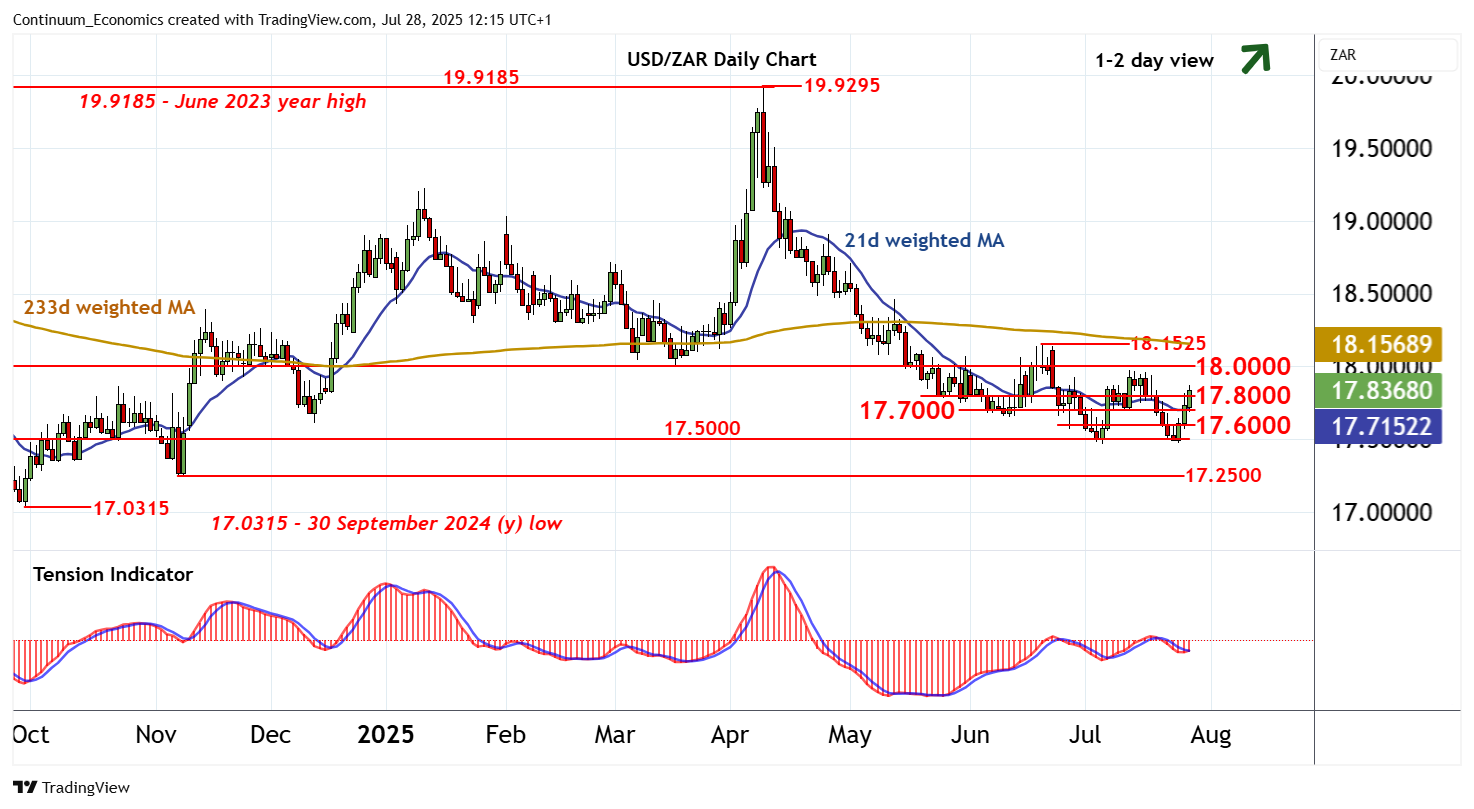
Chart USD/ZAR Update: Studies improving

The anticipated test of congestion resistance at 17.8000 has extended to 17.8750~
| Level | Comment | Level | Comment | |||||
|---|---|---|---|---|---|---|---|---|
| R4 | 18.4100~ | ** | 38.2% ret of Apr-Jul fall | S1 | 17.7000 | * | congestion | |
| R3 | 18.1525 | ** | 19 Jun (m) high | S2 | 17.6000 | * | congestion | |
| R2 | 18.0000 | ** | congestion | S3 | 17.5000 | ** | congestion | |
| R1 | 17.8000 | * | congestion | S4 | 17.2500 | ** | 7 Nov (m) low |
Asterisk denotes strength of level
11:55 BST - The anticipated test of congestion resistance at 17.8000 has extended to 17.8750~, where overbought intraday studies are prompting short-term reactions. Daily readings are improving and weekly charts are also turning higher, suggesting room for still further gains in the coming sessions. A close above 17.8000 will open up congestion around 18.0000. However, a close above 18.1525 monthly high of 19 June is needed to confirm a more sustainable rally and a near-term low in place around 17.5000. Meanwhile, support is raised to congestion around 17.7000 and extends to 17.6000. This range should underpin any immediate setbacks.