Chart USD/ZAR Update: Fresh 2026 low
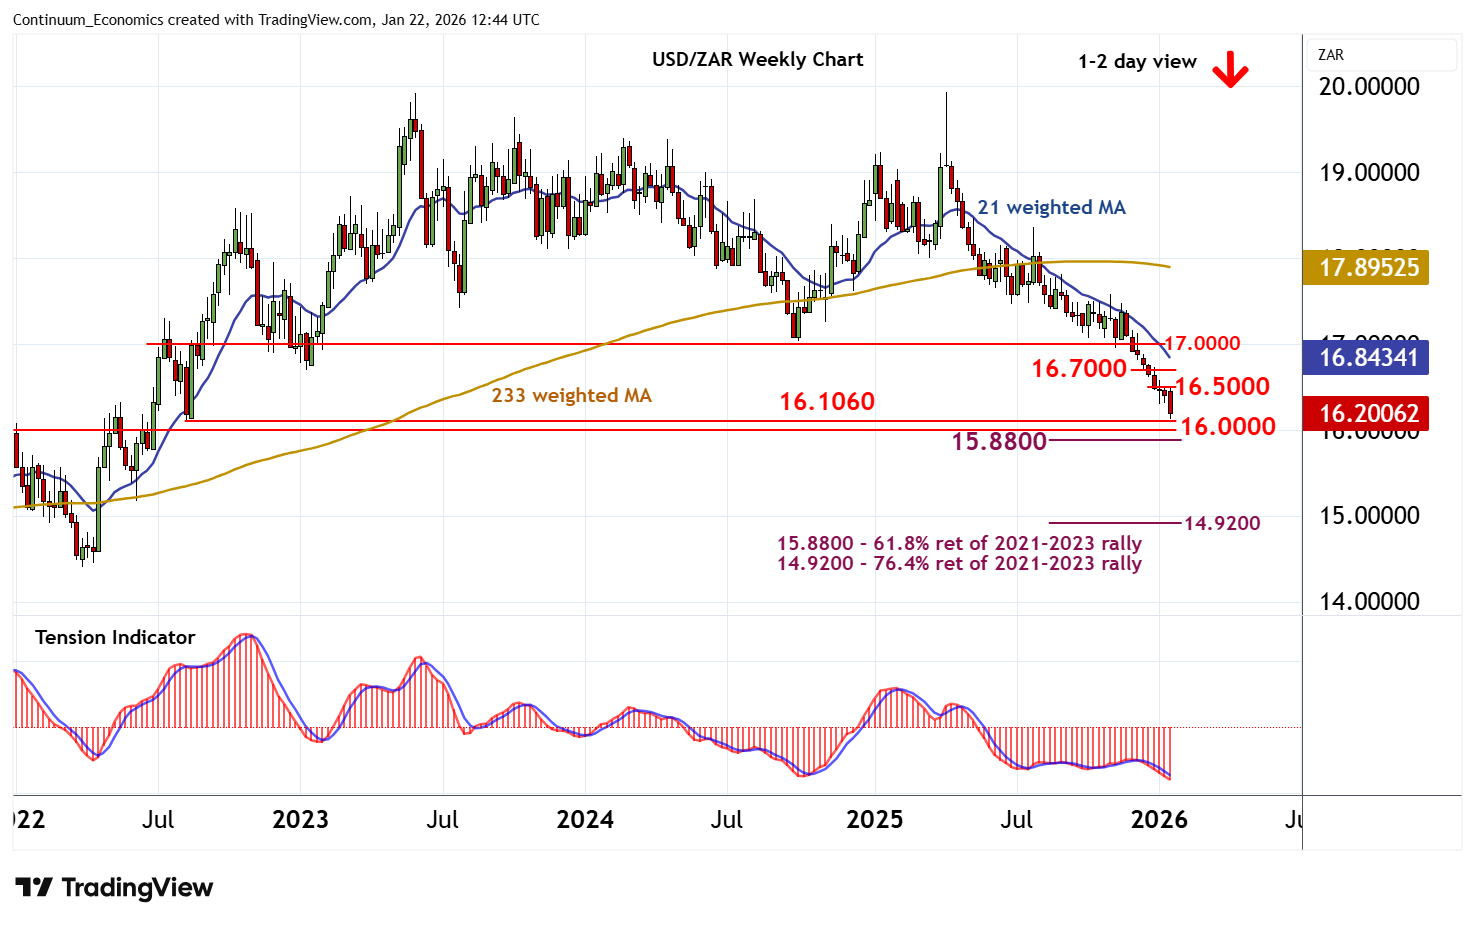
Anticipated selling interest has extended the April 2025 bear trend to post a fresh 2026 year low at 16.1200
| Level | Comment | Level | Comment | |||||
|---|---|---|---|---|---|---|---|---|
| R4 | 16.8000 | break level | S1 | 16.1200 | fresh 2026 (y) low | |||
| R3 | 16.7000 | break level | S2 | 16.1060 | ** | 11 Aug 2022 (m) low | ||
| R2 | 16.6000 | break level | S3 | 16.0000 | ** | congestion | ||
| R1 | 16.5000 | break level | S4 | 15.8800 | ** | 61.8% ret of 2021-2023 rally |
Asterisk denotes strength of level
12:20 GMT - Anticipated selling interest has extended the April 2025 bear trend to post a fresh 2026 year low at 16.1200. Daily readings have turned down and broader weekly charts are negative, highlighting room for still further losses in the coming sessions. A break beneath here will open up the 16.1060 monthly low of 11 August 2022 and historic congestion around 16.0000. Just lower is the 15.8800 Fibonacci retracement. But flat oversold weekly stochastics are expected to limit any initial tests of this broad 15.8800 - 16.1060 range in short-covering/consolidation, before negative longer-term charts extend losses still further. Meanwhile, resistance remains at 16.5000. A close above here, if seen, will help to stabilise price action and prompt consolidation beneath 16.6000.