Published: 2026-05-07T00:40:51.000Z
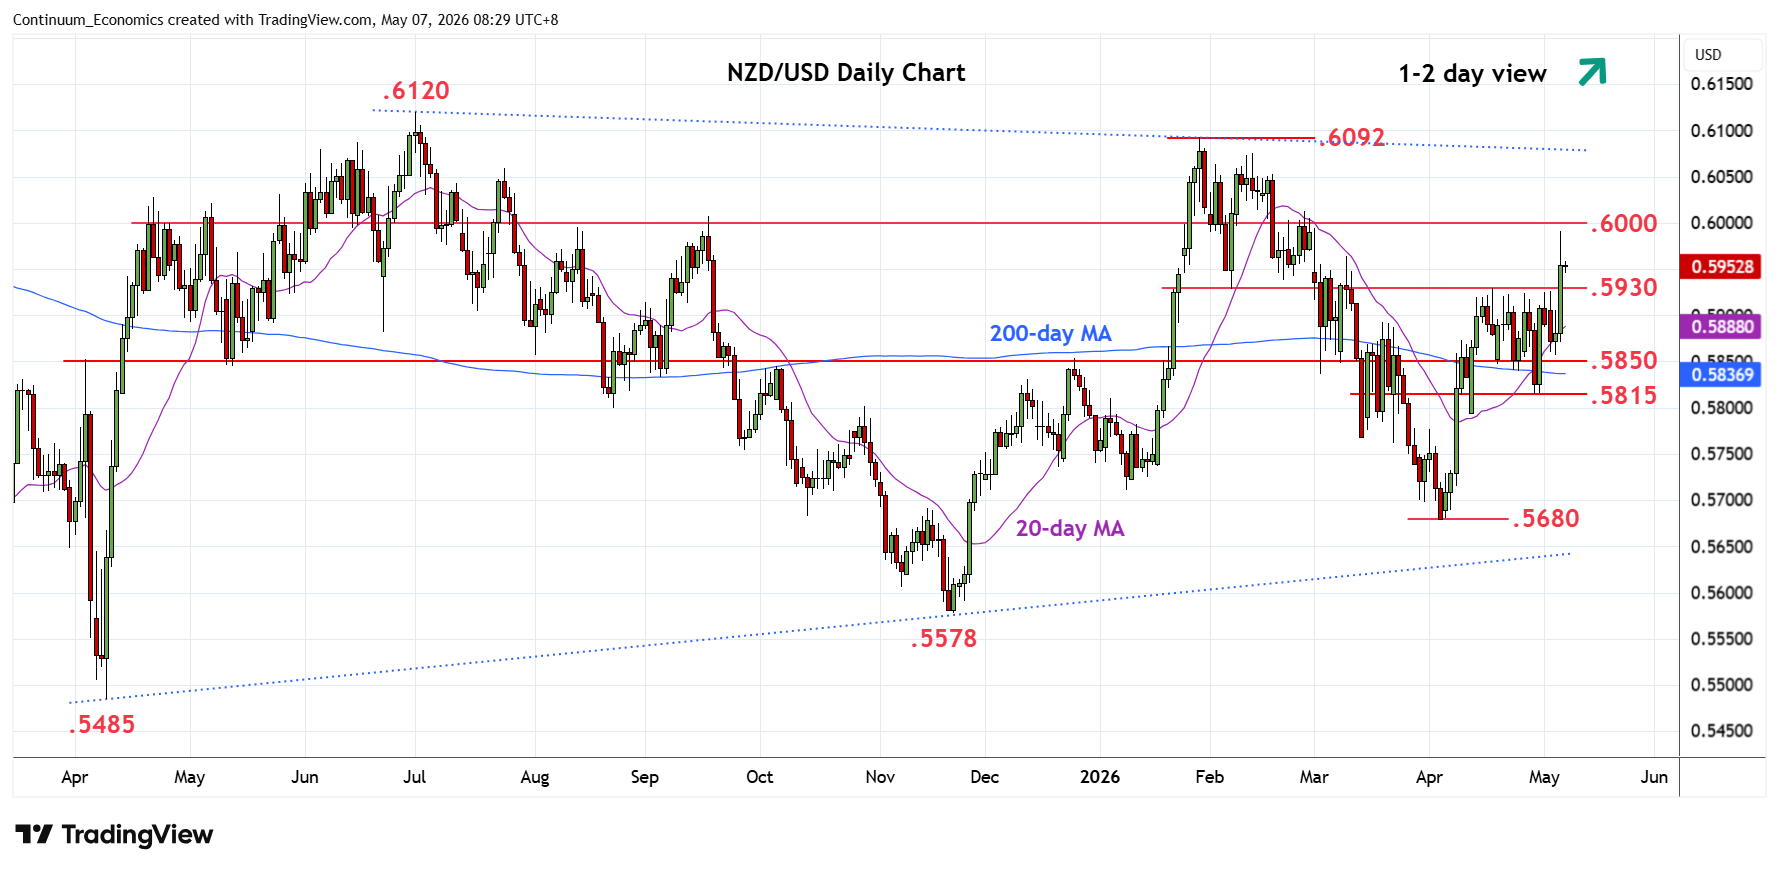
Chart NZD/USD Update: Consolidating below .6000 figure
-
Break above the .5930 April high to approach the .6000 figure has met with selling pressure at .5990 high
| Levels | Imp | Comment | Levels | Imp | Comment | |||
|---|---|---|---|---|---|---|---|---|
| R4 | .6120 | ** | Jul 2025 yr high | S1 | .5930 | ** | Apr high | |
| R3 | .6092 | ** | 29 Jan YTD high | S2 | .5850 | * | congestion | |
| R2 | .6050 | * | congestion | S3 | .5815 | ** | 29 Apr low | |
| R1 | .6000/10 | * | congestion, 26 Feb high | S4 | .5800 | * | congestion |
Asterisk denotes strength of level
00:35 GMT - Break above the .5930 April high to approach the .6000 figure has met with selling pressure at .5990 high. Prices has since settled back in consolidation but this is expected to give way to renewed buying interest later to further retrace the January/April losses. Above the .6000/10 congestion area with see room to the .6050 congestion but focus will turn to the .6092 current year high of 29 January. Meanwhile, support is raised to the .5930 April high which should underpin and sustain gains from the .5680 April current year low.