Chart USD Index DXY Update: Potential for a test higher

Cautious trade has given way to a reactive break higher
| Levels | Imp | Comment | Levels | Imp | Comment | |||
|---|---|---|---|---|---|---|---|---|
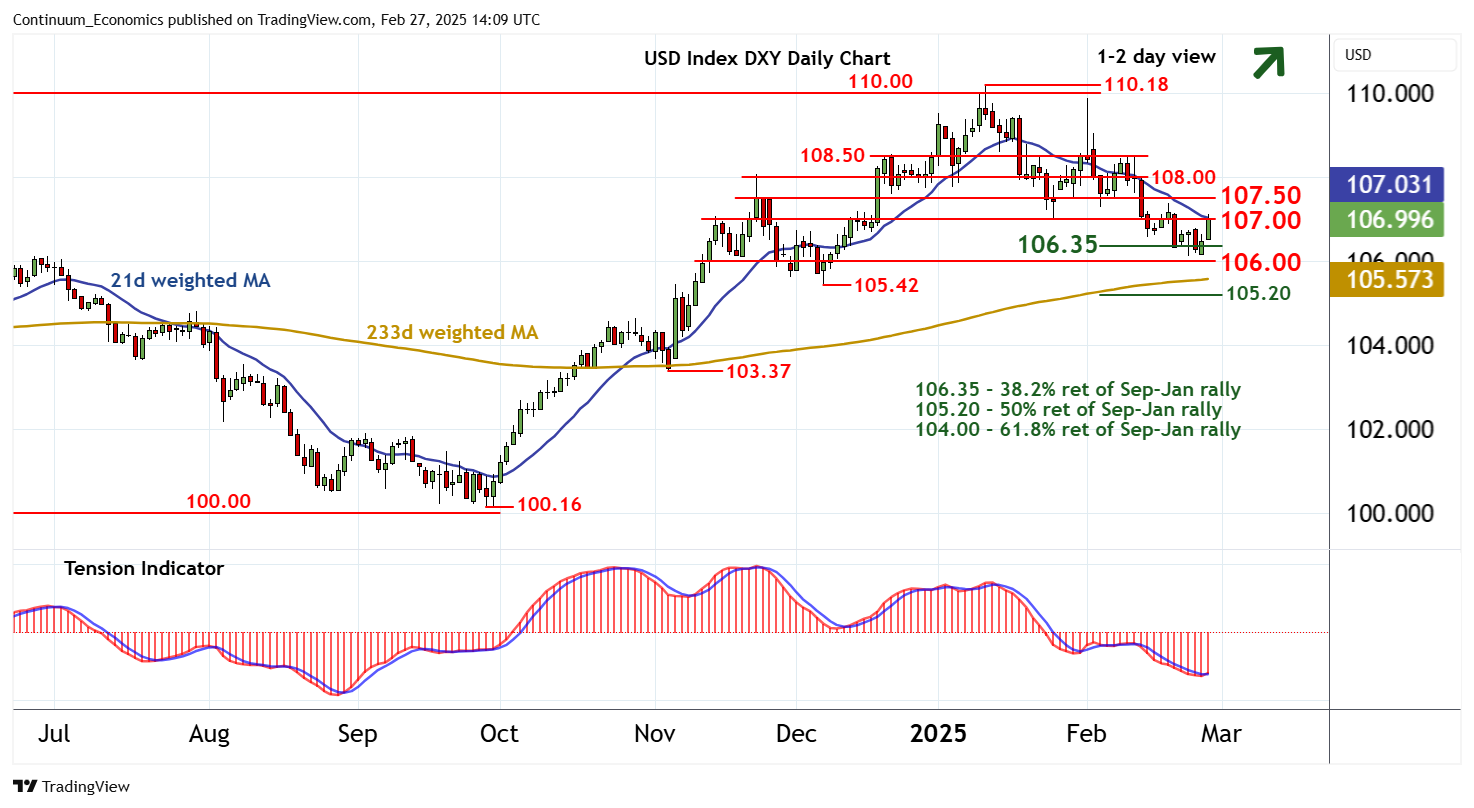
| R4 | 108.50 | minor break level | S1 | 106.35 | ** | 38.2% ret of Sep-Jan rally | ||
| R3 | 108.00 | break level | S2 | 106.00 | ** | congestion | ||
| R2 | 107.50 | * | congestion | S3 | 105.42 | ** | 6 Dec (m) low | |
| R1 | 107.00 | ** | break level | S4 | 105.20 | ** | 50% ret of Sep-Jan rally |
Asterisk denotes strength of level
13:55 GMT - Cautious trade has given way to a reactive break higher, with prices currently pressuring resistance at 107.00. Intraday studies are rising and daily readings are also showing signs of improvement, suggesting room for further strength in the coming sessions. A break above 107.00 will open up congestion around 107.50. But negative weekly charts are expected to prompt renewed selling interest towards here, and limit any break to below 108.00. Meanwhile, support remains at the 106.35 Fibonacci retracement and extends to congestion around 106.00. A close beneath here, not yet seen, will add weight to sentiment and extend January losses towards the 105.42 monthly low of 6 December.