Published: 2025-06-24T11:56:23.000Z
Chart USD/ZAR Update: Sharp reversal in USD-driven trade

Senior Technical Strategist
-
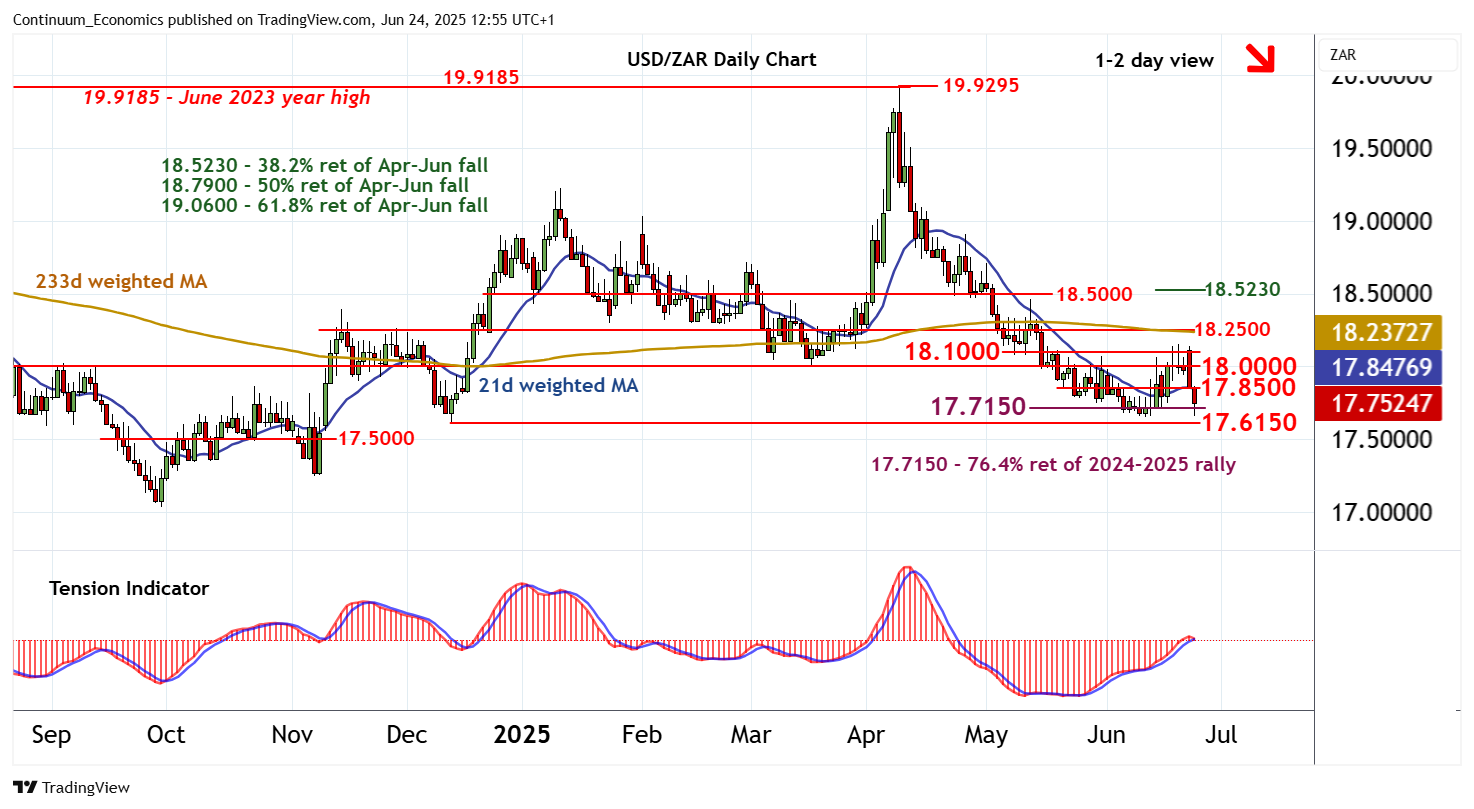
The test of resistance at 18.1000 has given way to sharp USD-driven losses
| Level | Comment | Level | Comment | |||||
|---|---|---|---|---|---|---|---|---|
| R4 | 18.2500 | * | congestion | S1 | 17.7150 | ** | 76.4% ret of 2024-2025 rally | |
| R3 | 18.1000 | * | break level | S2 | 17.6150 | ** | 12 Dec (m) low | |
| R2 | 18.0000 | ** | congestion | S3 | 17.5000 | * | congestion | |
| R1 | 17.8500 | break level | S4 | 17.2500 | ** | 7 Nov (m) low |
Asterisk denotes strength of level
12:40 BST - The test of resistance at 18.1000 has given way to sharp USD-driven losses, with prices currently trading around the 17.7150 Fibonacci retracement. Daily readings have turned down and broader weekly charts are under pressure, highlighting room for further losses in the coming sessions. A later break below the 17.6150 monthly low of 12 December will turn sentiment negative and extend losses from the 19.9250 current year high of 9 April, initially to congestion around 17.5000. Meanwhile, a close above resistance at 17.8500, if seen, will help to stabilise price action and prompt consolidation beneath 18.0000 - 18.1000.