Chart EUR/JPY Update: Balanced beneath multi-year highs
The anticipated test higher has met renewed selling interest at the 187.35 multi-year Fibonacci retracement
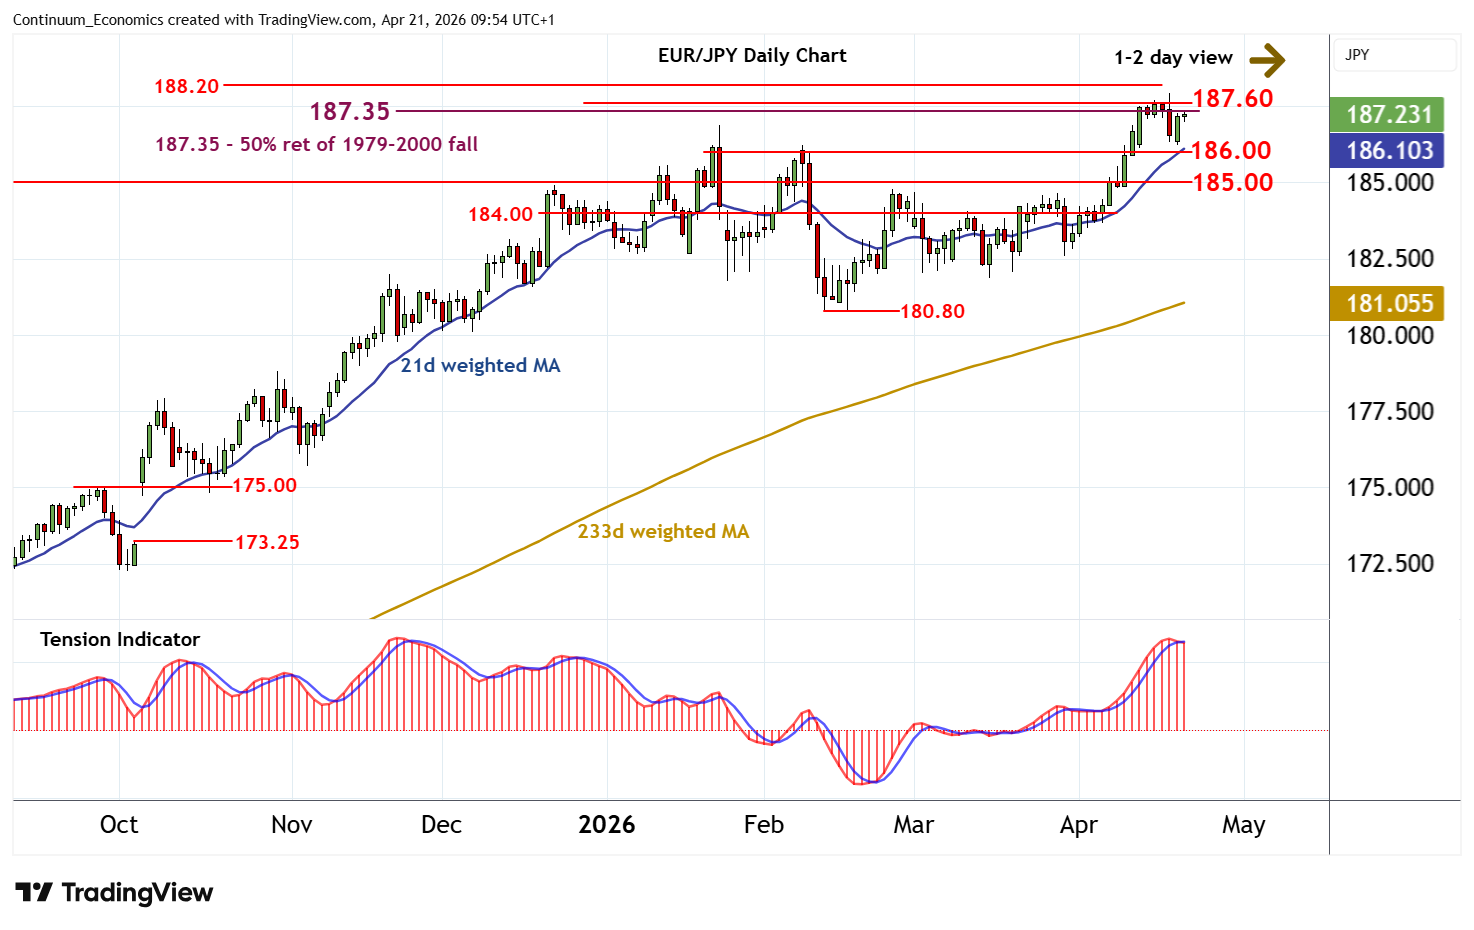
| Levels | Imp | Comment | Levels | Imp | Comment | |||
|---|---|---|---|---|---|---|---|---|
| R4 | 188.20~ | ** | May 1990 (y) high | S1 | 186.25 | 20 Apr low | ||
| R3 | 187.95/00 | * | 17 Apr YTD high; figure | S2 | 186.00 | * | congestion | |
| R2 | 187.60 | * | August 1990 high | S3 | 185.00 | ** | break level | |
| R1 | 187.35 | ** | 50% ret of 1979-2000 fall | S4 | 184.00 | * | congestion |
Asterisk denotes strength of level
09:45 BST - The anticipated test higher has met renewed selling interest at the 187.35 multi-year Fibonacci retracement, with prices currently consolidating around 187.20. Just higher is the 187.60 high of August 1990. But negative daily readings should limit any tests above this 187.35/60 range in renewed selling interest within the 187.95/00 - 188.20~ range. Broader weekly charts are improving, but a close above the 188.20~ multi-year high of May 1990 is needed to turn sentiment positive and confirm continuation of long-term gains. Meanwhile, support is at the 186.25 low of 20 April and extends to congestion around 186.00. A close beneath here would add weight to sentiment and open up 185.00, where rising weekly charts could prompt renewed buying interest.