Chart USD Index DXY Update: Under pressure
The test of 97.00 is giving way to anticipated consolidation
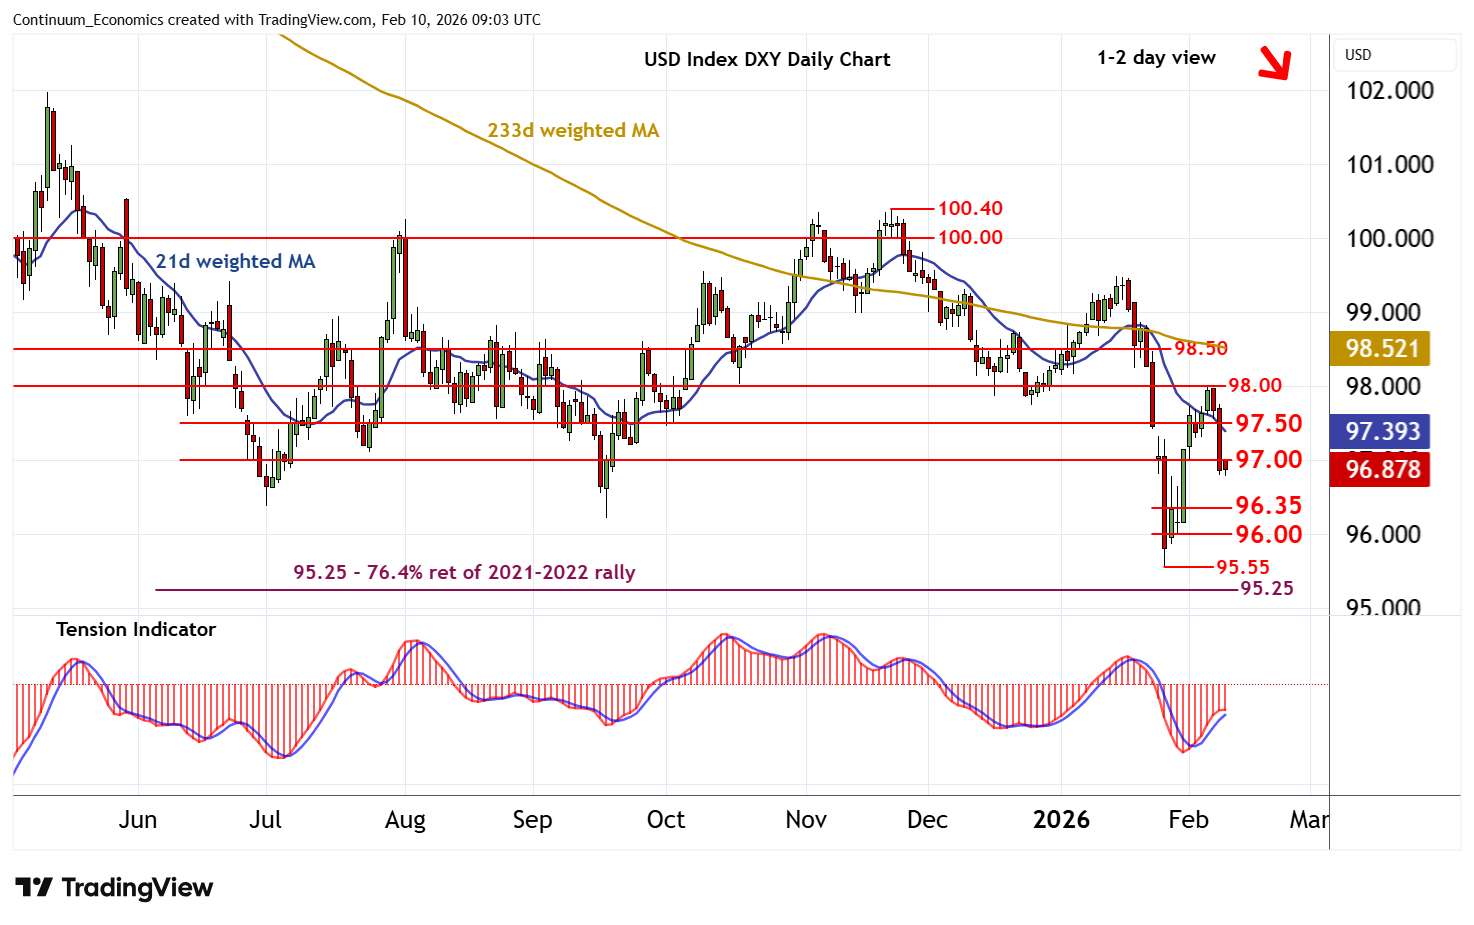
| Levels | Imp | Comment | Levels | Imp | Comment | |||
|---|---|---|---|---|---|---|---|---|
| R4 | 98.50 | * | congestion | S1 | 96.35 | congestion | ||
| R3 | 98.00 | * | congestion | S2 | 96.00 | * | congestion | |
| R2 | 97.50 | ** | congestion | S3 | 95.55 | ** | 27 Jan YTD low | |
| R1 | 97.00 | * | congestion | S4 | 95.25 | ** | 76.4% ret of 2021-2022 rally |
Asterisk denotes strength of level
08:50 GMT - The test of 97.00 is giving way to anticipated consolidation, as oversold intraday studies flatten, with prices currently balanced around 96.85. Daily stochastics are turning down and the positive daily Tension Indicator is flattening, suggesting room for further losses in the coming sessions. A break below the 96.79 low of 9 February will add weight to sentiment and open up minor congestion around 96.35. Already oversold intraday studies could prompt short-term consolidation around here, before further losses target congestion around 96.00. Meanwhile, a close back above congestion resistance at 97.00 will help to stabilise price action and prompt consolidation beneath further congestion around 97.50.