Published: 2025-10-24T15:29:11.000Z
Chart USD/CAD Update: Back in range
2
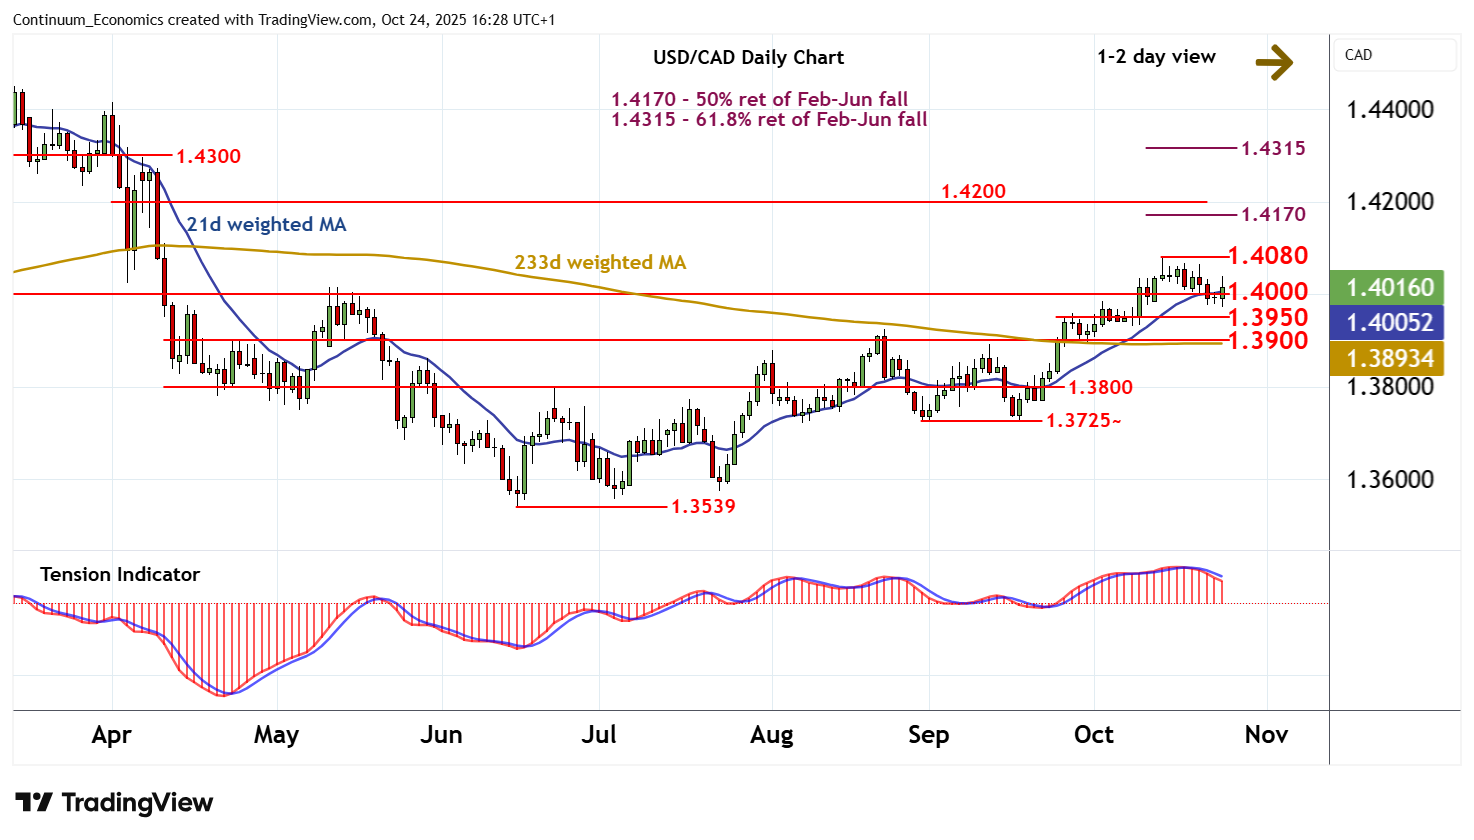
The break below 1.4000 has not been sustained
| Levels | Imp | Comment | Levels | Imp | Comment | |||
|---|---|---|---|---|---|---|---|---|
| R4 | 1.4200 | ** | break level | S1 | 1.3950 | * | pivot | |
| R3 | 1.4170 | ** | 50% ret of Feb-Jun fall | S2 | 1.3900 | ** | break level | |
| R2 | 1.4080 | ** | 14 Oct (w) high | S3 | 1.3800 | * | congestion | |
| R1 | 1.4000 | * | break level | S4 | 1.3725~ | ** | 29 Aug - 17 Sep lows |
Asterisk denotes strength of level
16:15 BST - The break below 1.4000 has not been sustained, with prices once again balanced in cautious trade above here. Intraday studies are mixed/positive and oversold daily stocahstics are flattening, suggesting room for a test higher. But mixed weekly charts should limit initial scope in consolidation beneath the 1.4080 weekly high of 14 October. A close above here, however, would turn sentiment positive and confirm continuation of June gains towards the 1.4170 Fibonacci retracement. Meanwhile, support is at 1.3950 and extends to 1.3900. This range should underpin any immediate setbacks.