Published: 2026-03-13T07:09:25.000Z
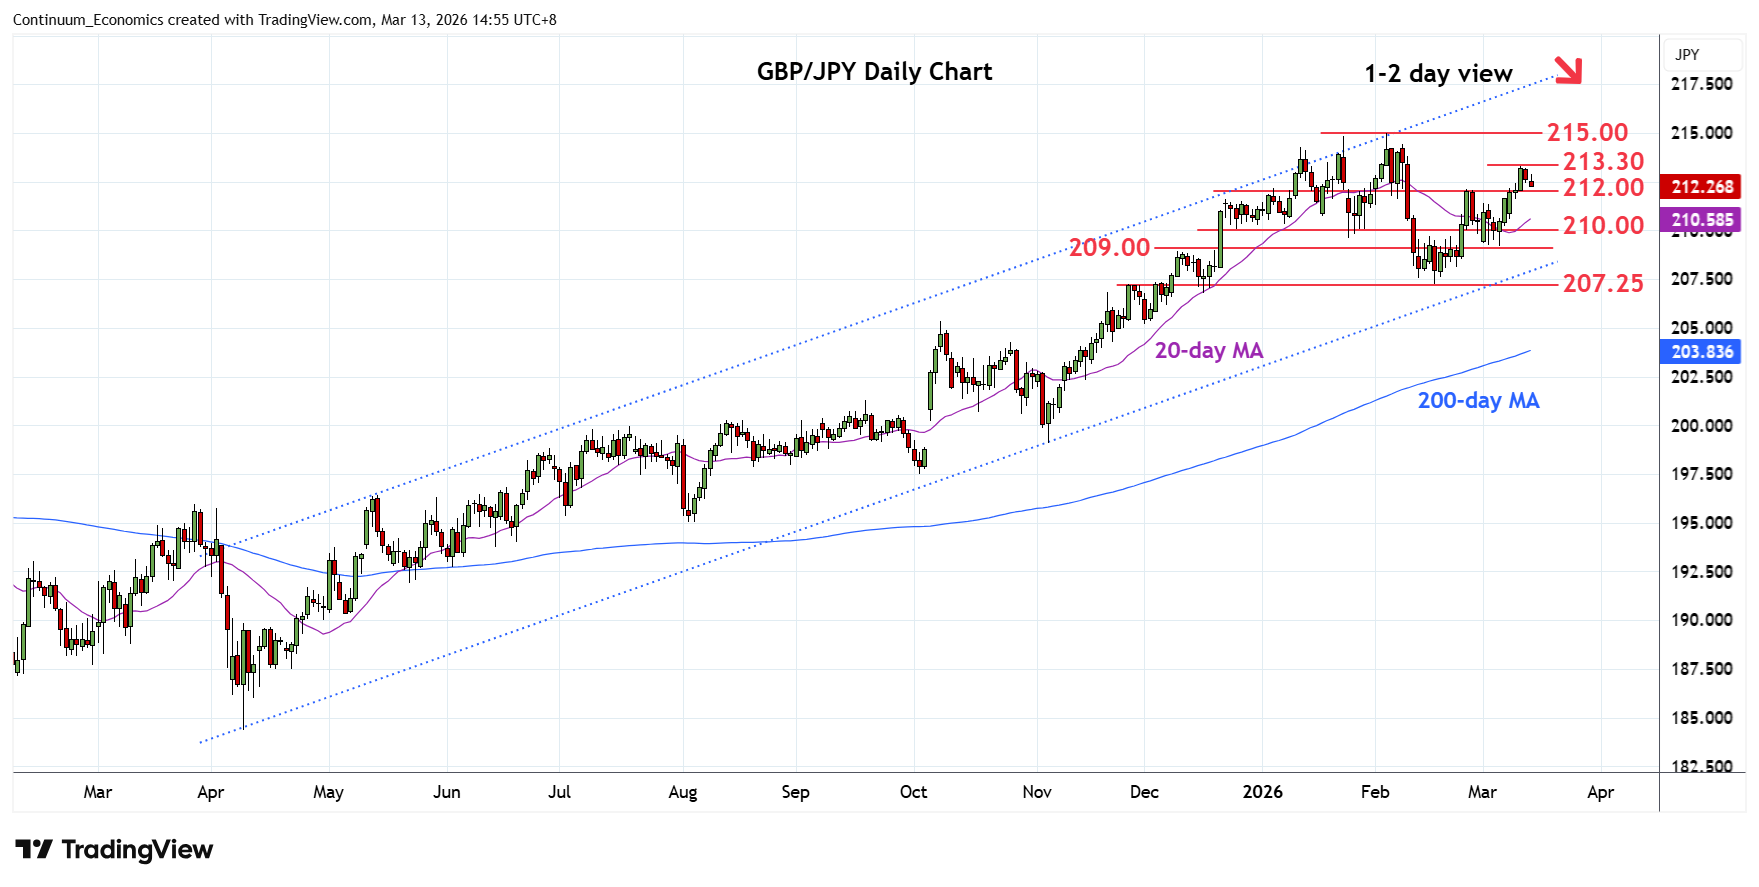
Chart GBP/JPY Update: Lower in range from 213.30 high
-
Lower in range from the 213.30 high as prices unwind overbought intraday and daily studies
| Levels | Imp | Comment | Levels | Imp | Comment | |||
|---|---|---|---|---|---|---|---|---|
| R4 | 215.90 | ** | Jul 2008 year high | S1 | 212.00 | ** | 25 Feb high | |
| R3 | 215.00 | ** | 4 Feb YTD high | S2 | 211.00 | * | congestion | |
| R2 | 214.00 | * | congestion | S3 | 210.00 | * | congestion | |
| R1 | 213.30 | ** | 11 Mar high | S4 | 209.20/00 | * | 3 Mar low, congestion |
Asterisk denotes strength of level
07:00 GMT - Lower in range from the 213.30 high as prices unwind overbought intraday and daily studies. Pullback see support at the 212.00, 25 Feb high. Would take break here to open up room for deeper pullback to retrace gains from the 207.25 February current year low and see room to the 211.00/210.00 congestion area and the 209.20, 3 March low. Break of these will return focus to the downside for retest of 208.00 congestion and 207.25, February low. Meanwhile, resistance at 213.30 high is expected to cap and contain bounce attempt.