Chart GBP/USD Update: Consolidating test of 1.2600/40 - studies rising

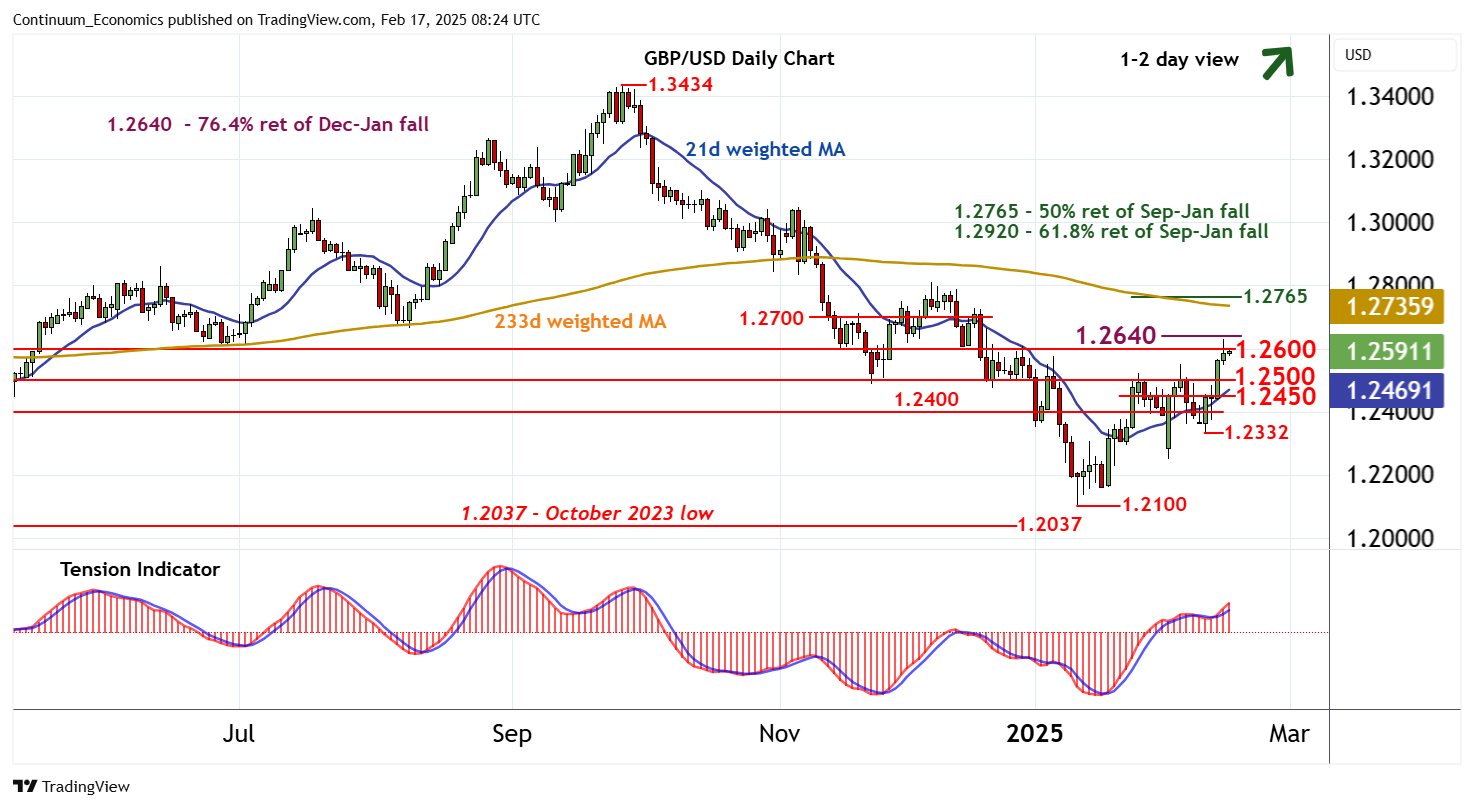
The test of resistance at congestion around 1.2600 and the 1.2640 Fibonacci retracement is giving way to consolidation
| Level | Comment | Level | Comment | |||||
|---|---|---|---|---|---|---|---|---|
| R4 | 1.2765 | ** | 50% ret of Sep-Jan fall | S1 | 1.2500 | * | break level | |
| R3 | 1.2700 | * | congestion | S2 | 1.2450 | break level | ||
| R2 | 1.2640 | ** | 76.4% ret of Dec-Jan fall | S3 | 1.2400 | * | congestion | |
| R1 | 1.2600 | * | congestion | S4 | 1.2332 | 11 Feb low |
Asterisk denotes strength of level
08:10 GMT - The test of resistance at congestion around 1.2600 and the 1.2640 Fibonacci retracement is giving way to consolidation, as overbought intraday studies unwind, with prices currently balanced around 1.2590. Daily readings continue track higher, however, and broader weekly charts are also positive, pointing to room for further strength in the coming sessions. A close above 1.2640 is needed to turn sentiment positive and extend January gains towards congestion around 1.2700. Meanwhile, support is down to 1.2500. An unexpected break beneath here will turn price action neutral and prompt consolidation above 1.2450.