Continuum Economics
  • Search
  • About Us
  • Buy
  • Invite A Friend
  • My Basket
  • Articles
  • Calendar
  • Forecasts
  • Events
  • Data
  • Newsletters
  • My Alerts
  • Community
  • Directory
  • About Us
  • Buy
  • Invite A Friend
  • My Basket
  • Articles
    • All
    • Thematic
    • Tactical
    • Asia
    • EMEA
    • Americas
    • Newsletters
    • Freemium
    • Editor's Choice
    • Most Viewed
    • Most Shared
    • Most Liked
  • Calendar
    • Interactive
      • China
      • United States
      • Eurozone
      • United Kingdom
    • Month Ahead
    • Reviews
    • Previews
  • Forecasts
    • Forecasts
    • Key Views
  • Events
    • Media
    • Conference Calls
  • Data
    • Country Insights
    • Shadow Credit Ratings
    • Full CI Data Download
  • Newsletters
  • My Alerts
  • Community
    • FX
    • Fixed Income
    • Macro Strategy
    • Credit Markets
    • Equities
    • Commodities
    • Precious Metals
    • Renewables
  • Directory
  • My Account
  • Notifications Setup
  • Administration Panel
  • Account Details
  • Recent Devices
  • Distribution Lists
  • Shared Free Trials
  • Saved Articles
  • Shared Alerts
  • My Posts
Published: 2025-12-19T12:28:50.000Z

Chart USD/ZAR Update: Consolidating losses - any gains to remain limited

-

Little change, as prices extend cautious trade

 Level Comment  Level Comment
R4 17.5000**congestion S1 16.6950 17 Dec YTD low
R3 17.4000*congestion S2 16.6900**January 2023 (y) low
R2 17.2000*congestion S3 16.6500**50% ret of 2021-2023 rally
R1 17.0000**congestion S4 16.1060**August 2022 low

Asterisk denotes strength of level

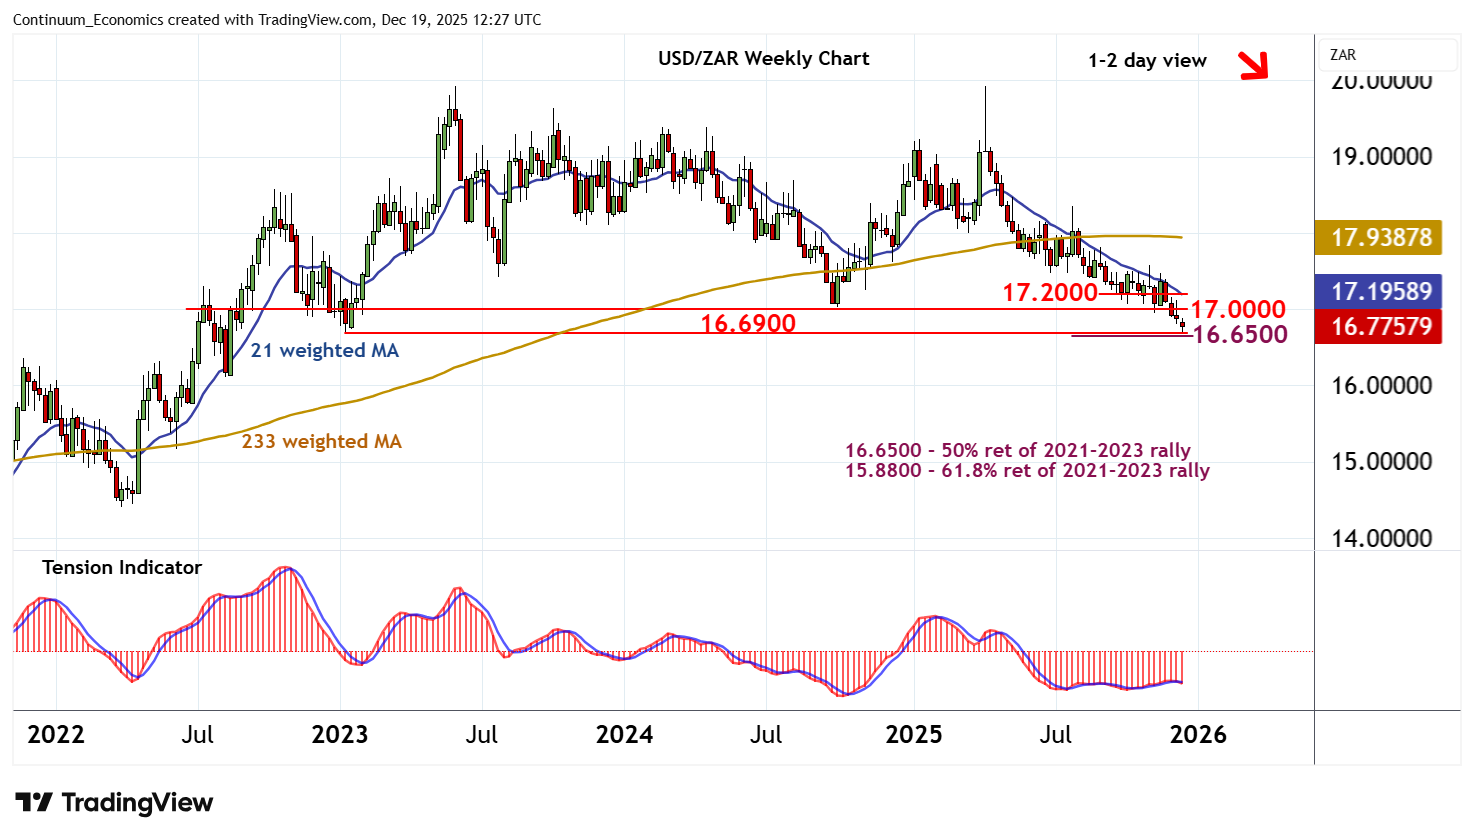
12:15 GMT - Little change, as prices extend cautious trade above strong support at the 16.6900 year low of January 2023 and 16.6950 current year low of 17 December. Oversold daily stochastics are unwinding, highlighting potential for a minor bounce. But the negative daily Tension Indicator and bearish weekly charts are expected to limit scope in renewed selling interest beneath congestion resistance at 17.0000. Following cautious trade, fresh losses are looked for. A later break below 16.6900 will extend April losses towards the 16.6500 Fibonacci retracement. However, already oversold weekly stochastics could limit any initial tests in short-covering/consolidation.

Continue to read the article for free
Login

or

or

Topics
USD/ZAR-TA
Technical Analysis
EEMEA-Technical

GENERAL

  • Home
  • About Us
  • Our Team
  • Careers

LEGAL

  • Terms and Conditions
  • Privacy Policy
  • Compliance
  • GDPR

GET IN TOUCH

  • Contact Us
Continuum Economics
The Technical Analyst Awards Winner 2021
The Technical Analyst Awards Finalist 2020
image