Published: 2026-05-05T11:13:45.000Z
Chart USD/ZAR Update: Limited tests lower
-
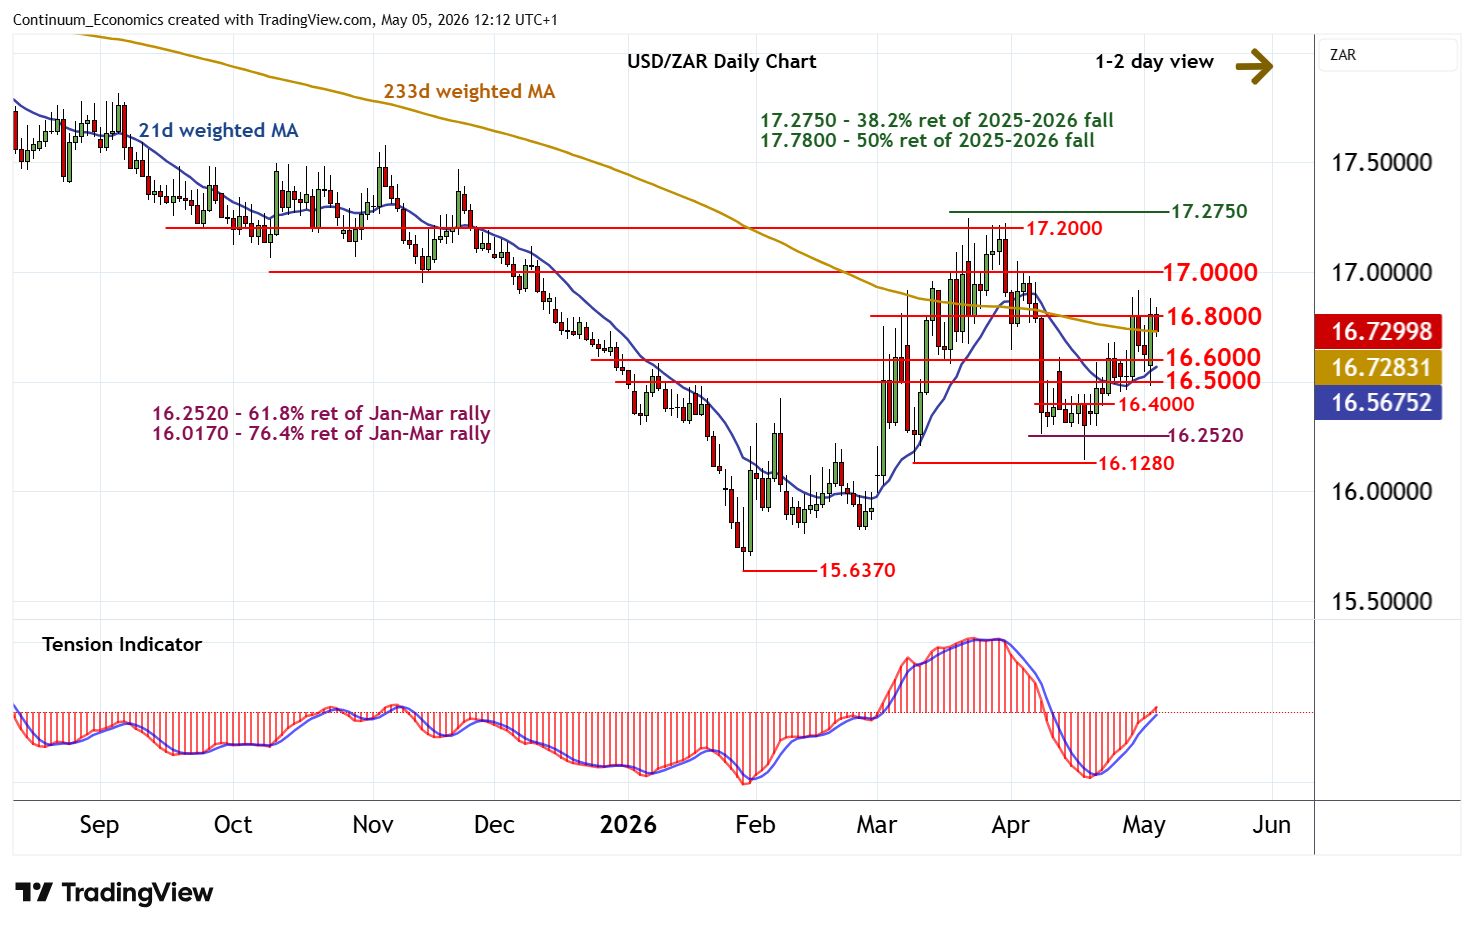
The anticipated pullback below 16.8000 has reached 16.7050, where short-term consolidation is developing
| Level | Comment | Level | Comment | |||||
|---|---|---|---|---|---|---|---|---|
| R4 | 17.2750 | ** | 38.2% ret of 2025-2026 fall | S1 | 16.6000 | break level | ||
| R3 | 17.2000 | ** | break level | S2 | 16.5000 | break level | ||
| R2 | 17.0000 | * | congestion | S3 | 16.4000 | congestion | ||
| R1 | 16.8000 | * | congestion | S4 | 16.2520 | ** | 61.8% ret of Jan-Mar rally |
Asterisk denotes strength of level
11:50 BST - The anticipated pullback below 16.8000 has reached 16.7050, where short-term consolidation is developing. Negative intraday studies highlight room for further losses. But rising daily readings readings and improving weekly charts should limit scope in renewed buying interest/consolidation above support at 16.6000. Following cautious/corrective trade, fresh gains are looked for. A close above 16.8000 would help to improve sentiment and extend mid-April gains towards further congestion around 17.0000.