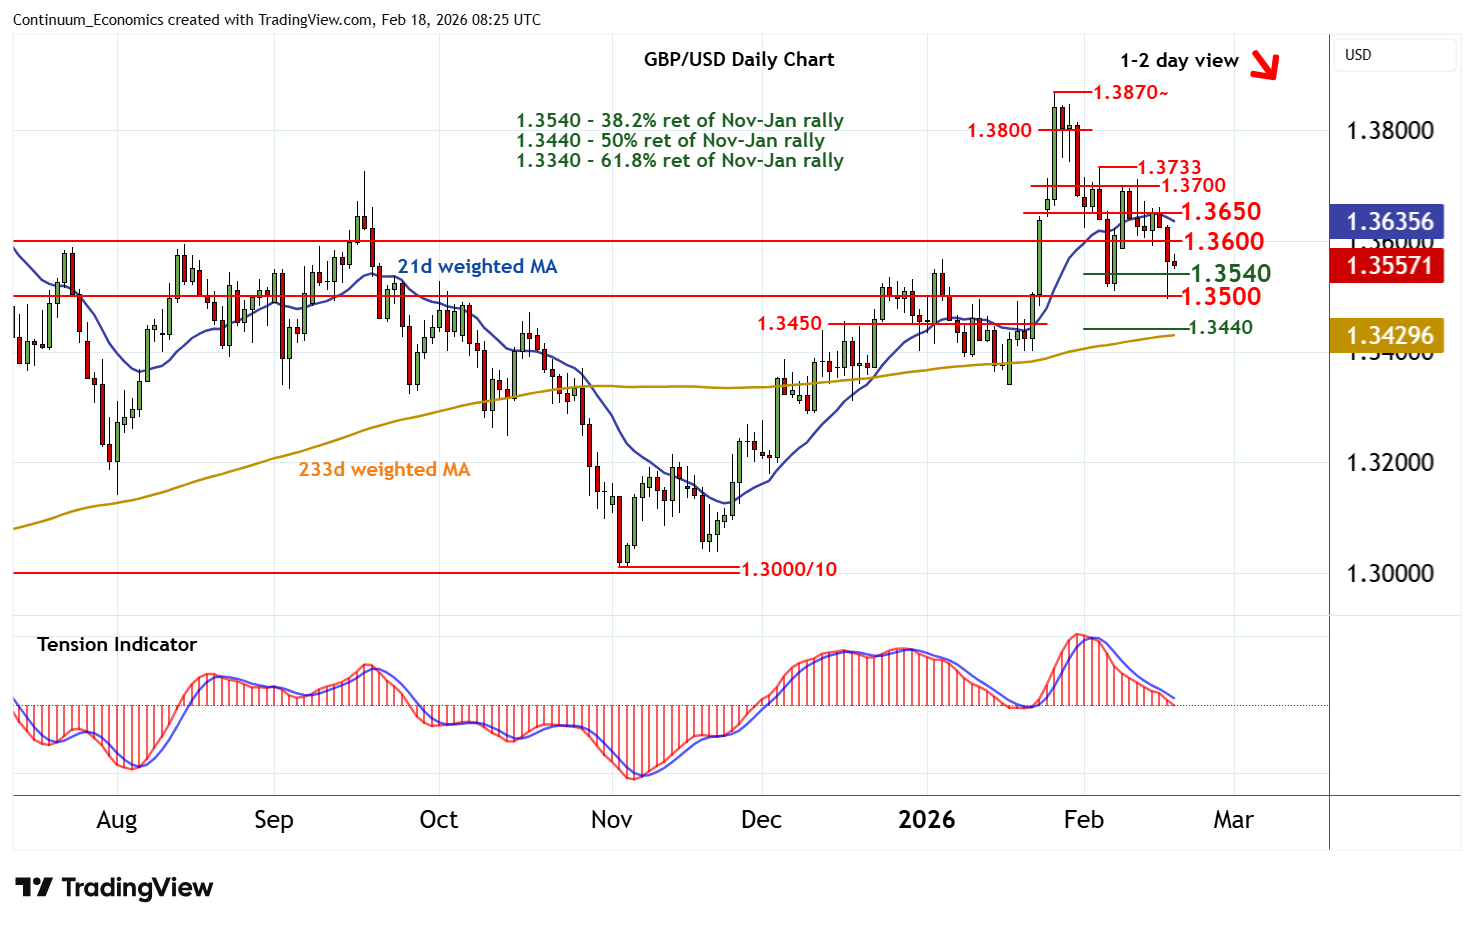
Chart GBP/USD Update: Smart bounce, but studies remain under pressure
The anticipated break below the 1.3540 Fibonacci retracement has reached congestion support at 1.3500
| Level | Comment | Level | Comment | |||||
|---|---|---|---|---|---|---|---|---|
| R4 | 1.3733 | * | 4 Feb (w) high | S1 | 1.3540 | * | 38.2% ret of Nov-Jan rally | |
| R3 | 1.3700 | break level | S2 | 1.3500 | ** | congestion | ||
| R2 | 1.3650 | * | break level | S3 | 1.3440/50 | ** | 50% ret; congestion | |
| R1 | 1.3600 | * | congestion | S4 | 1.3400 | ** | congestion |
Asterisk denotes strength of level
08:10 GMT - The anticipated break below the 1.3540 Fibonacci retracement has reached congestion support at 1.3500, where unwinding oversold intraday studies have prompted a sharp bounce back to 1.3565. Daily readings continue to track lower and broader weekly charts are also turning down, highlighting room for fresh losses in the coming sessions. A close below 1.3540 will add weight to sentiment. But a further close below 1.3500 would confirm continuation of late-January losses, as increased selling pressure opens up a test of the 1.3440/50 range. Meanwhile, resistance remains at congestion around 1.3600. A close above here is needed to help stabilise price action once again and prompt consolidation beneath 1.3650.