Chart GBP/USD Update: October gains pressuring the 1.2880 Fibonacci retracement
The anticipated break above 1.2800/27 has extended October gains to resistance at the 1.2880 Fibonacci retracement
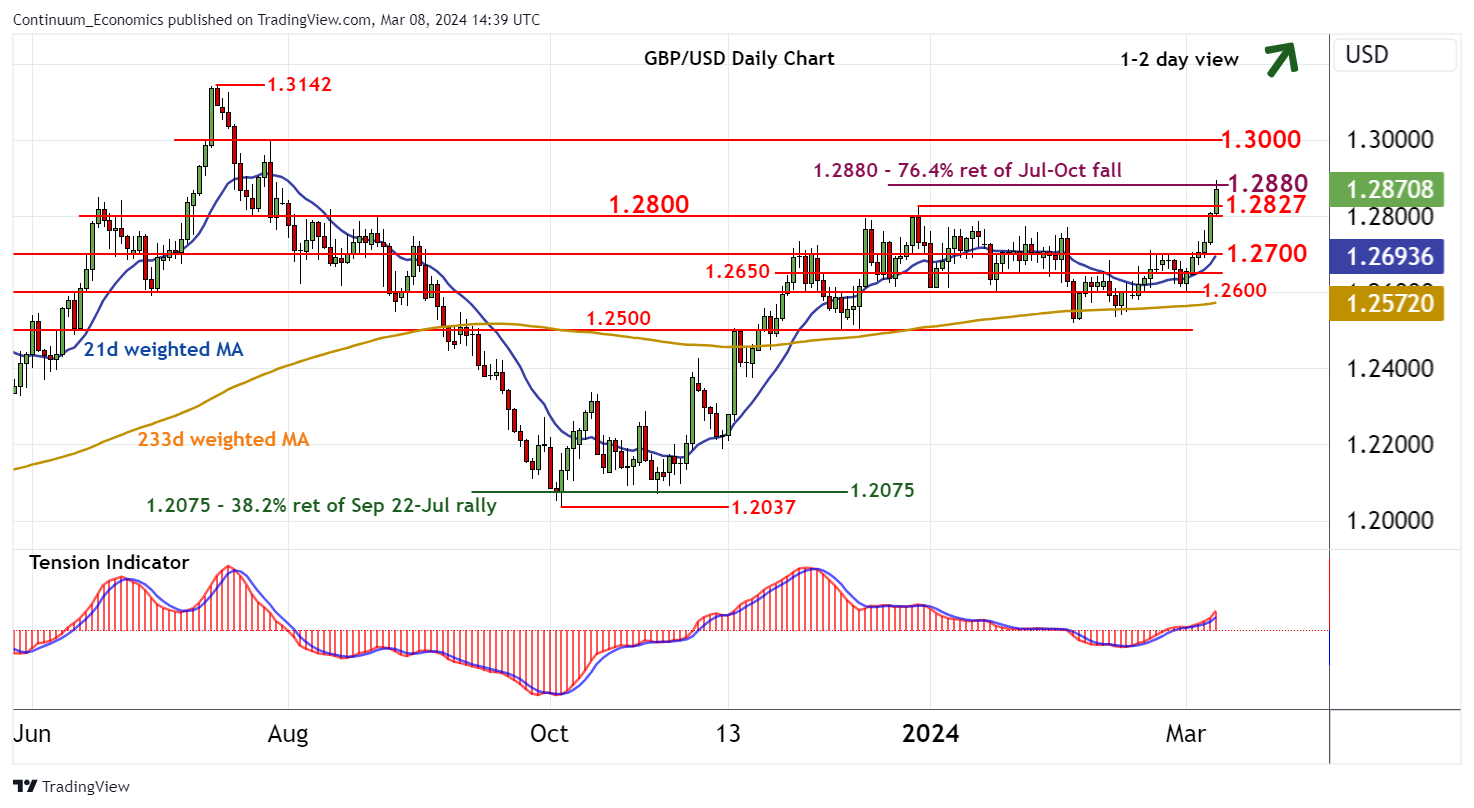
| Level | Comment | Level | Comment | |||||
|---|---|---|---|---|---|---|---|---|
| R4 | 1.3126 | 18 Jul (w) high | S1 | 1.2827 | ** | 28 Dec (m) high | ||
| R3 | 1.3040 | 19 Jul high | S2 | 1.2800 | * | break level | ||
| R2 | 1.3000 | ** | congestion | S3 | 1.2700 | * | break level | |
| R1 | 1.2880 | ** | 76.4% ret of Jul-Oct fall | S4 | 1.2650 | * | congestion |
Asterisk denotes strength of level
14:30 GMT - The anticipated break above 1.2800/27 has extended October gains to resistance at the 1.2880 Fibonacci retracement, where overbought intraday studies and overbought daily stochastics are prompting short-term reactions. The daily Tension Indicator is positive and broader weekly charts are improving, pointing to potential for further gains in the coming sessions. However, a close above 1.2880 is needed to turn sentiment positive and open up congestion resistance at 1.3000. Meanwihle, support is raised to the 1.2827 monthly high of 28 December and 1.2800. An unexpected close beneath here will turn price action neutral and prompt congestion above 1.2700.