Published: 2026-03-03T08:23:53.000Z
Chart AUD/NZD Update: Extending gains
1
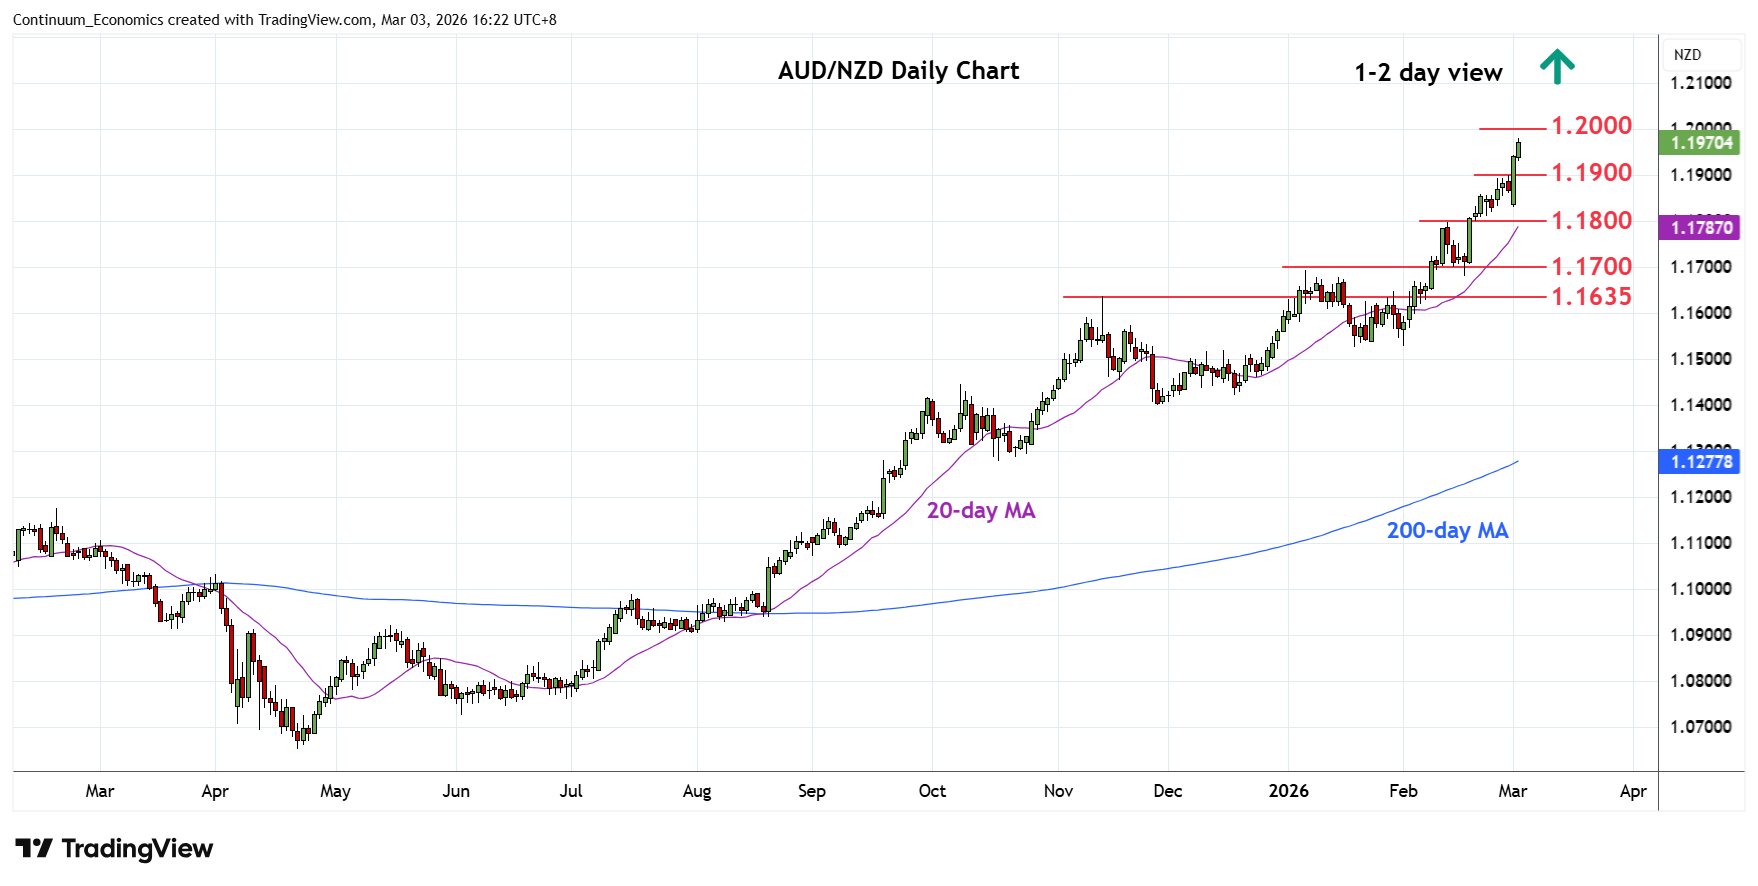
Break above the 1.1900 Fibonacci level see prices extending bullish gains from the April 2025 year low to approach 1.2000
| Level | Comment | Level | Comment | |||||
|---|---|---|---|---|---|---|---|---|
| R4 | 1.2200 | * | congestion | S1 | 1.1900 | * | congestion | |
| R3 | 1.2140 | * | Feb 2013 low | S2 | 1.1800 | * | congestion | |
| R2 | 1.2100 | * | Jun 2013 high | S3 | 1.1750 | * | congestion | |
| R1 | 1.2000 | ** | figure, congestion | S4 | 1.1700/80 | ** | congestion, 17 Feb low |
Asterisk denotes strength of level
08:20 GMT - Break above the 1.1900 Fibonacci level see prices extending bullish gains from the April 2025 year low to approach the 1.2000 figure where reaction can be expected. Daily and weekly studies are deep into overbought areas and caution corrective pullback here. Meanwhile, support is raised to the 1.1900 level which should now underpin. Would take break here to ease the upside pressure and open up room for corrective pullback to 1.1800 congestion then the strong support at 1.1700/1.1635 previous highs.