Published: 2025-11-03T02:01:12.000Z
Chart GBP/USD Update: Consolidating at 1.3100 level
3
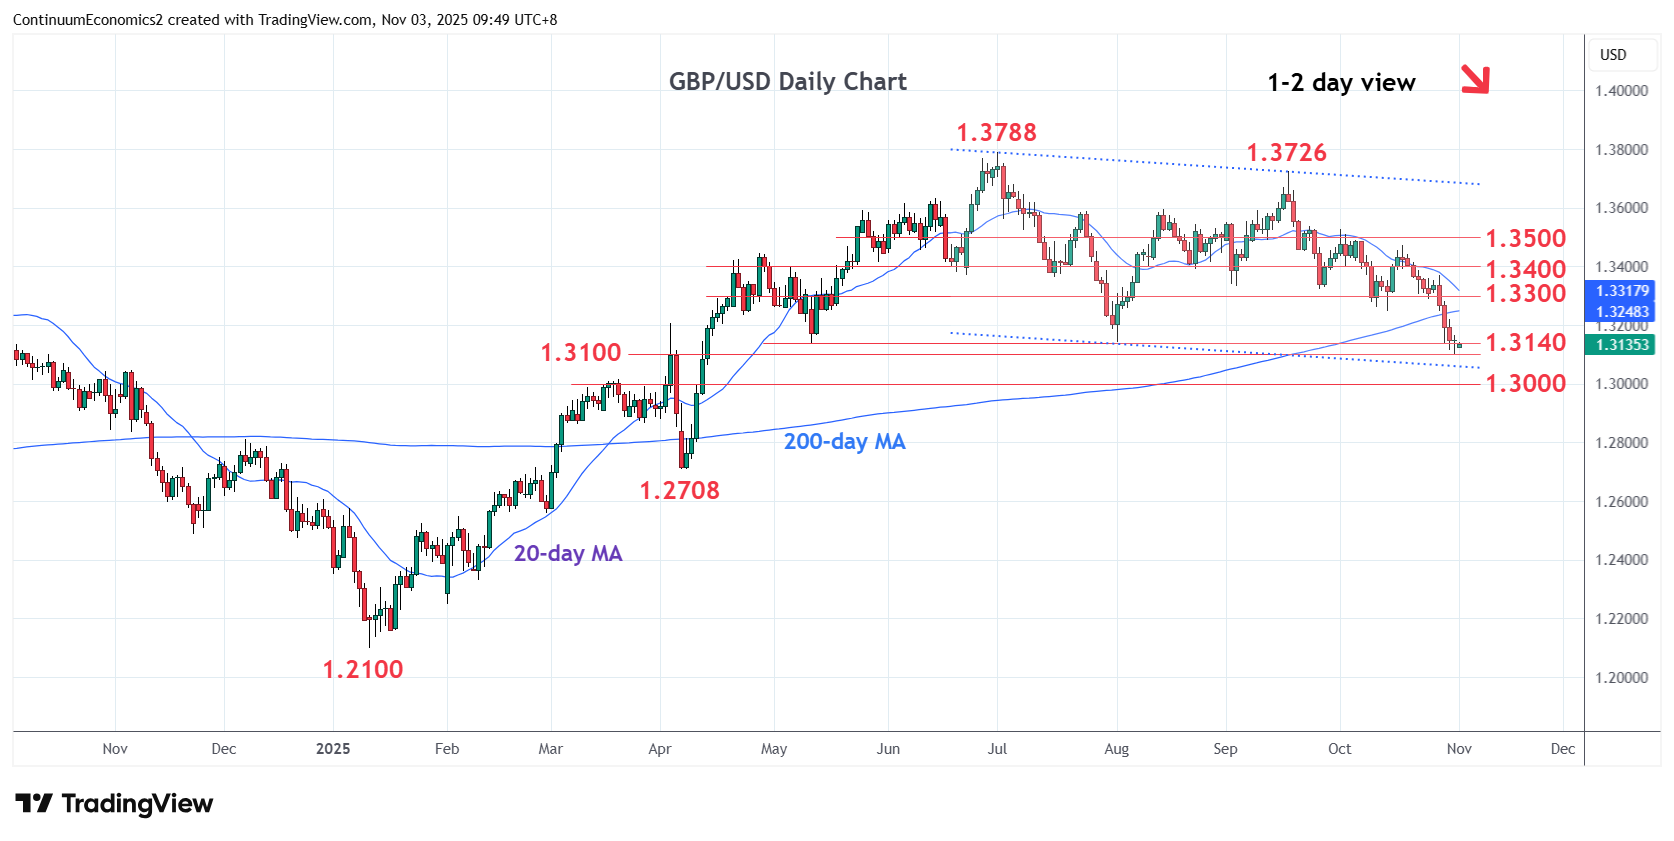
Break of 1.3140, May/August lows and 38.2% Fibonacci level, has seen losses to tag the 1.3100 level
| Level | Comment | Level | Comment | |||||
|---|---|---|---|---|---|---|---|---|
| R4 | 1.3471 | ** | 17 Oct high | S1 | 1.3100 | * | congestion | |
| R3 | 1.3400 | * | congestion | S2 | 1.3050 | * | congestion | |
| R2 | 1.3300/24 | * | congestion, Sep low | S3 | 1.3000 | * | figure, congestion | |
| R1 | 1.3200/48 | * | congestion, 14 Oct low | S4 | 1.2950 | * | 50% Jan/Jul rally |
Asterisk denotes strength of level
02:00 GMT - Break of 1.3140, May/August lows and 38.2% Fibonacci level, has seen losses to tag the 1.3100 level. Consolidation see prices unwinding the stretched intraday studies but a later break cannot be ruled out. Lower will see room for extension to the 1.3050/1.3000 congestion area. Meanwhile, resistance is lowered to the 1.3200/48 level and low of 14 October, now expected to cap. Would need to regain this to fade the downside pressure and open up room for return to resistance at the 1.3300/1.3400 congestion.